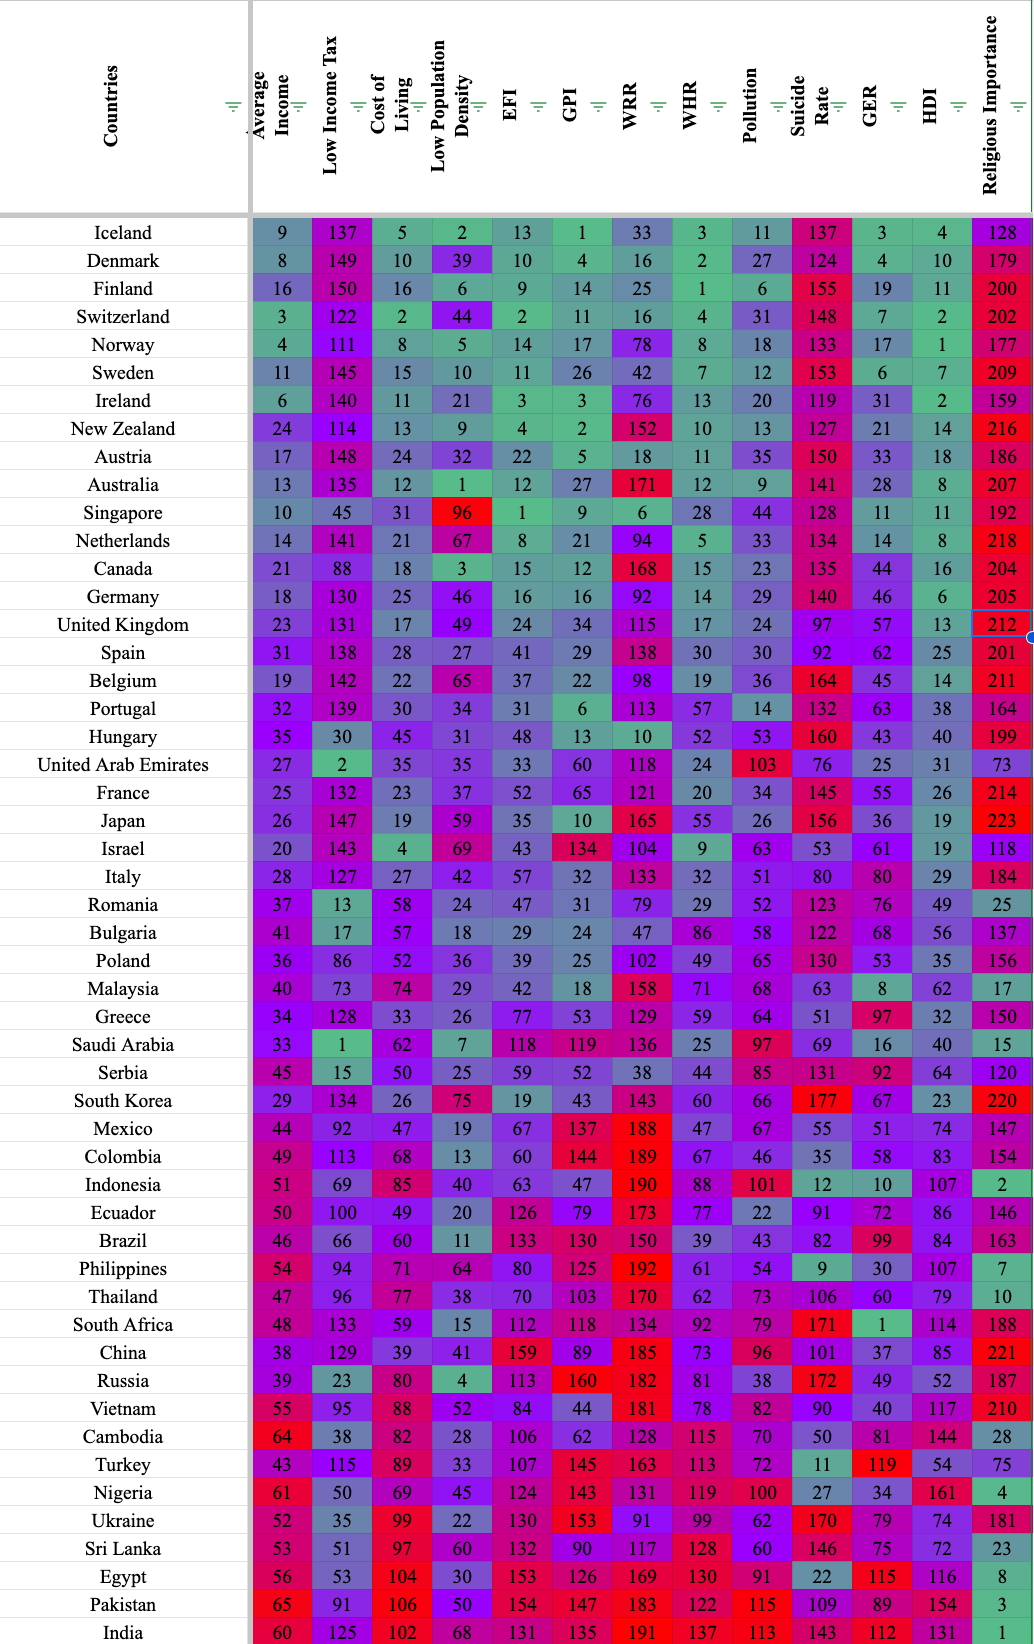
r/dataisbeautiful • u/oscarleo0 • 38m ago
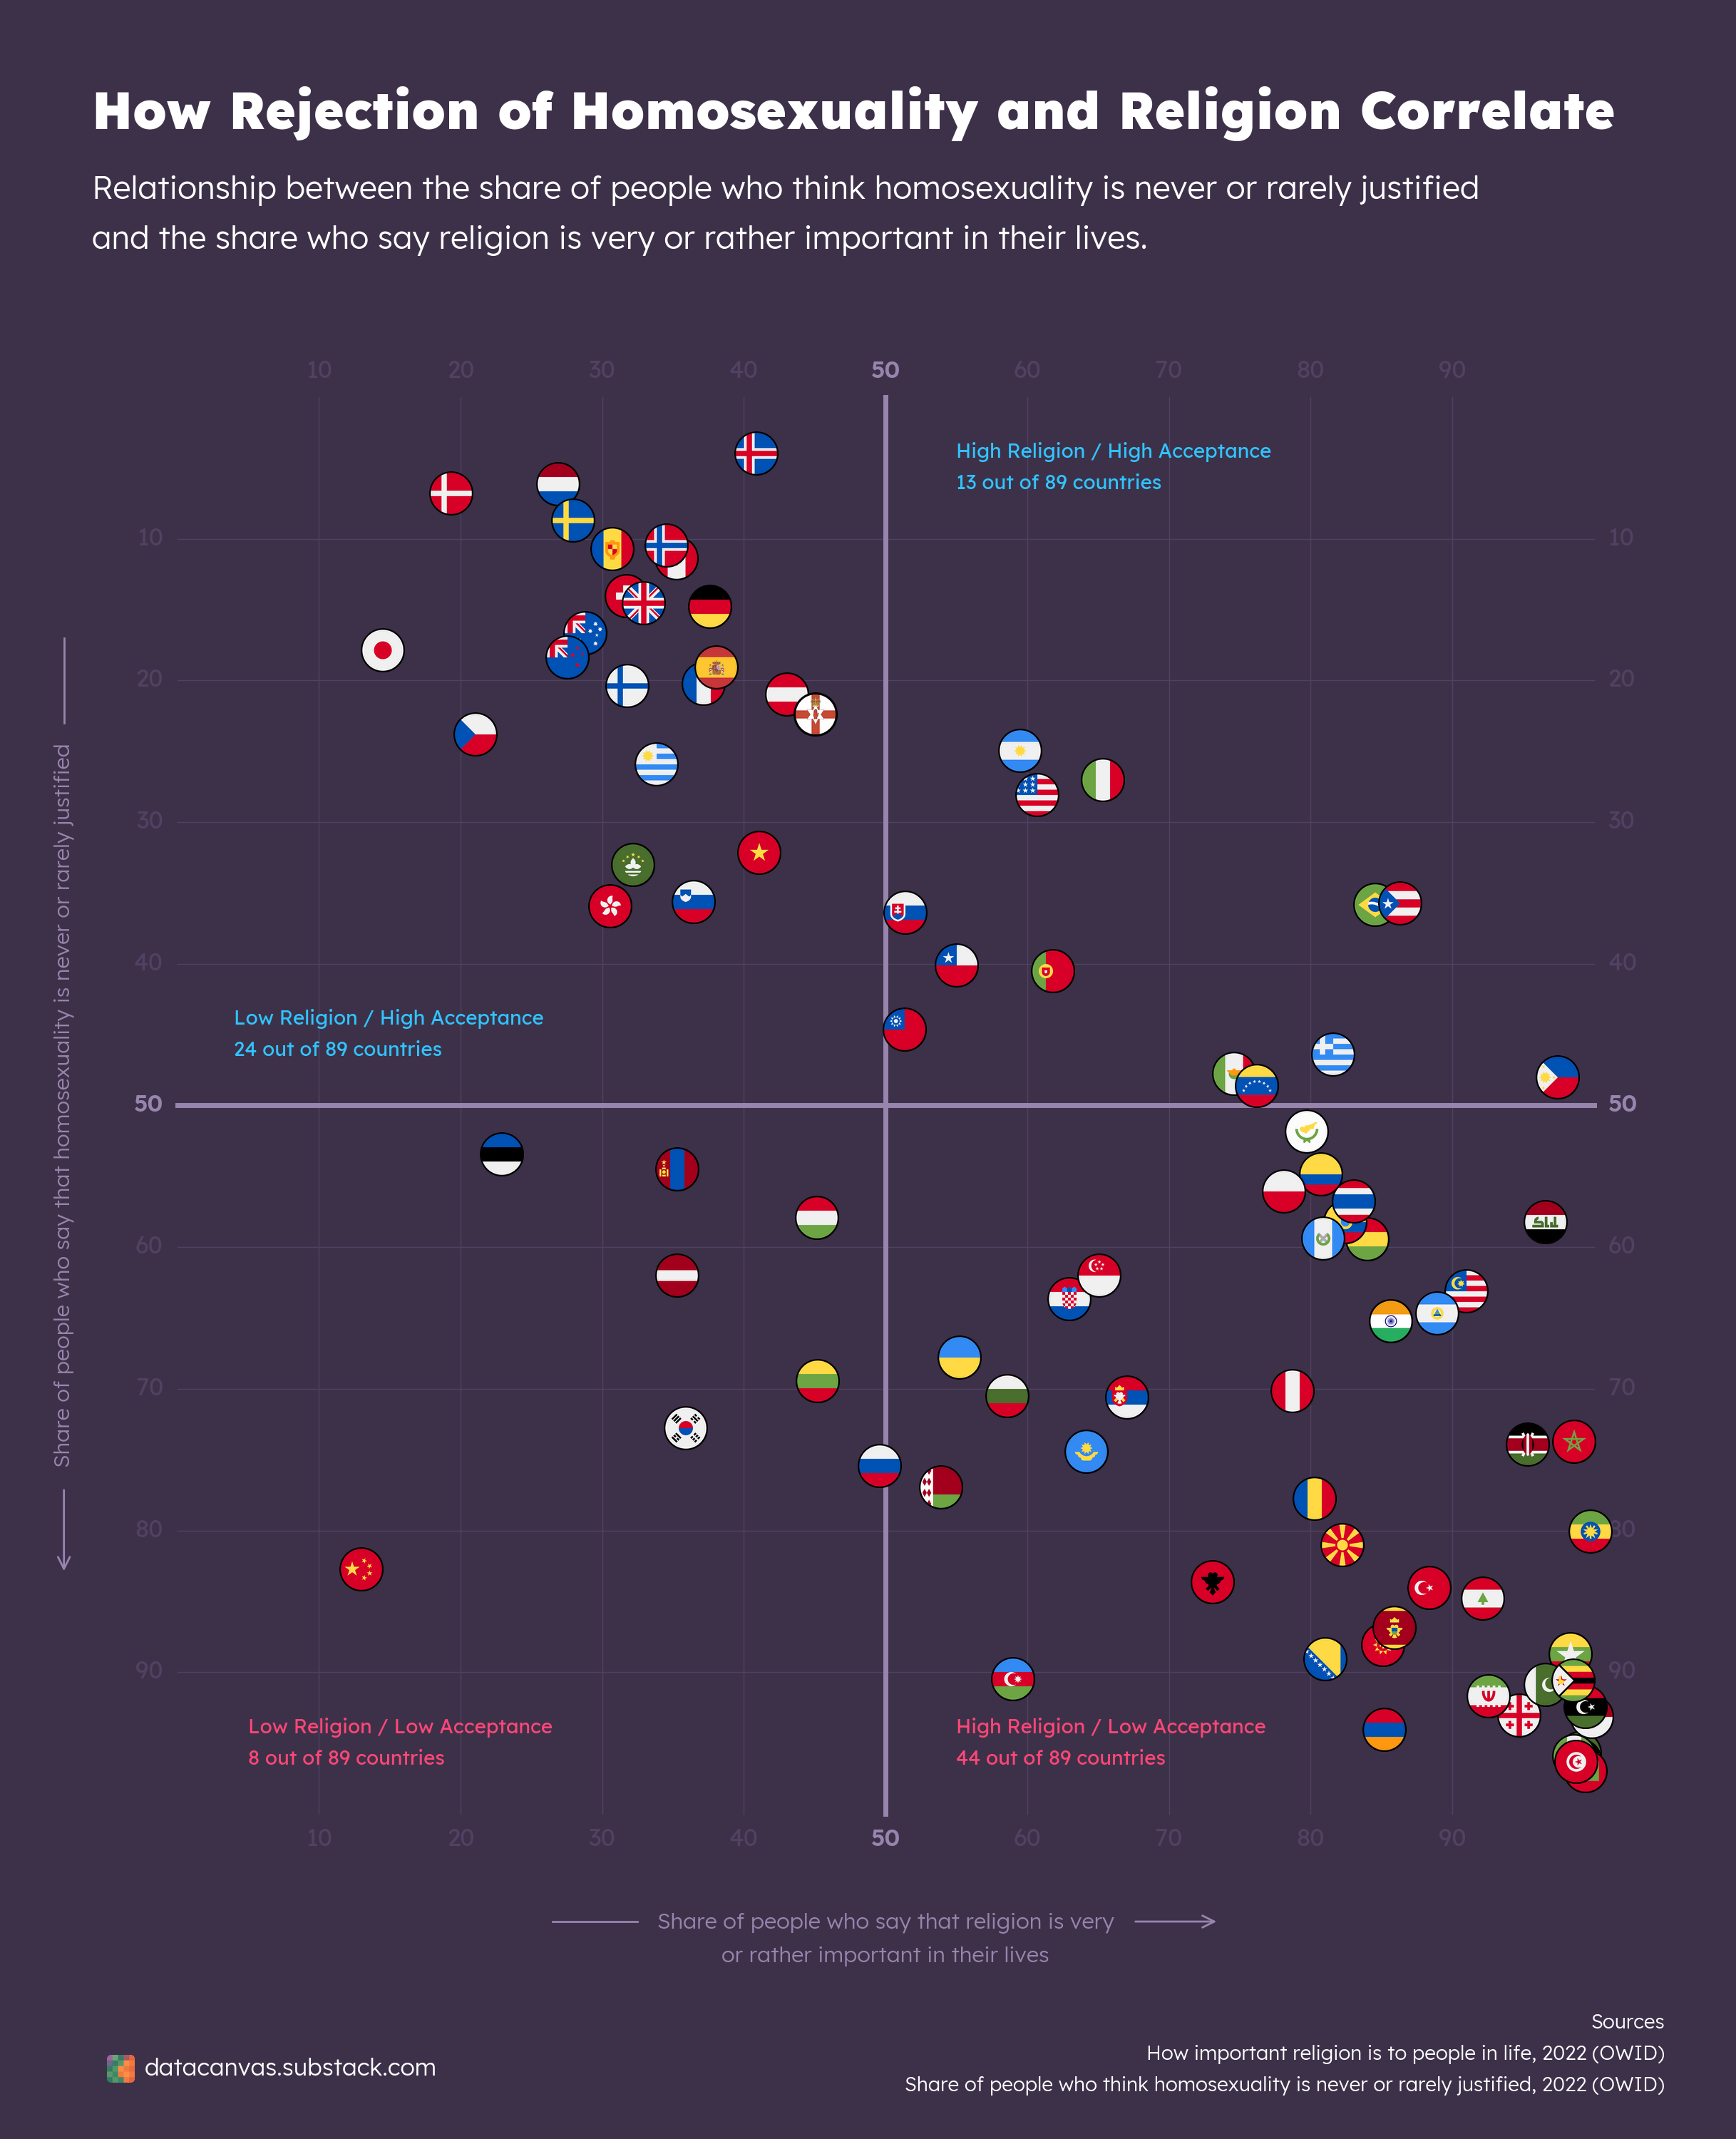
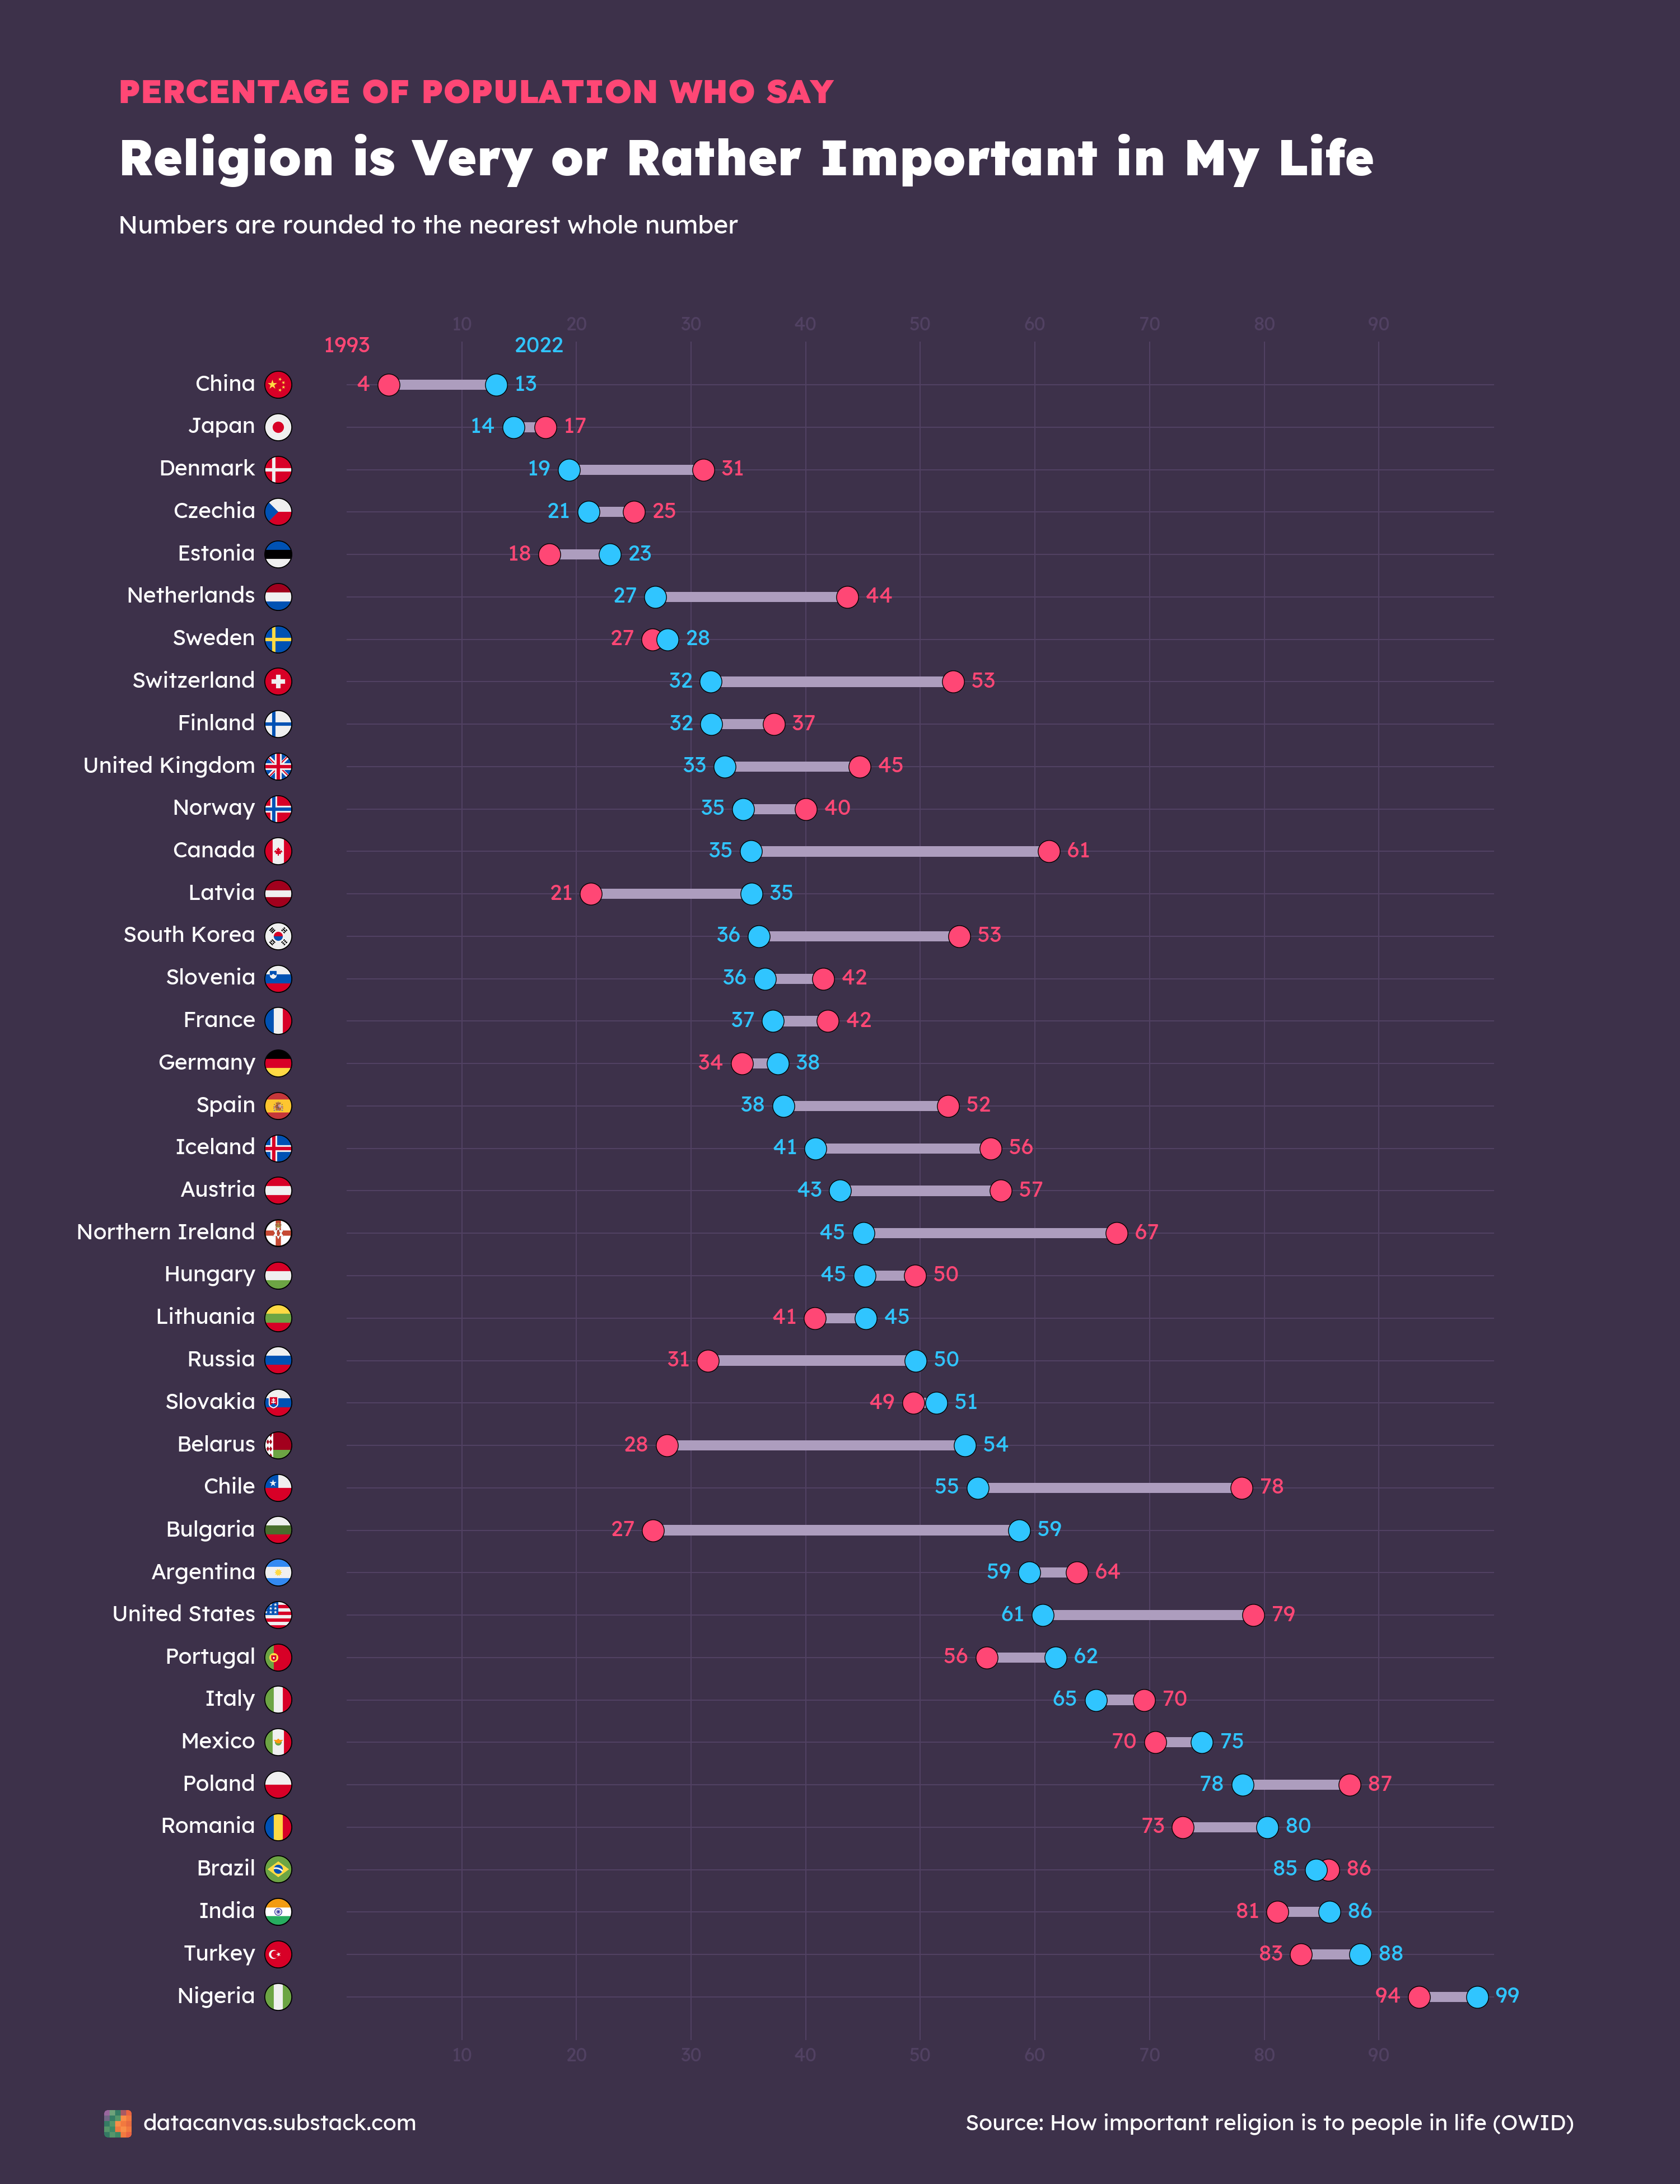
OC [OC] How Rejection of Homosexuality and Religion Correlate
•
Upvotes
r/dataisbeautiful • u/AutoModerator • 24d ago
Anybody can post a question related to data visualization or discussion in the monthly topical threads. Meta questions are fine too, but if you want a more direct line to the mods, click here
If you have a general question you need answered, or a discussion you'd like to start, feel free to make a top-level comment.
Beginners are encouraged to ask basic questions, so please be patient responding to people who might not know as much as yourself.
To view all Open Discussion threads, click here.
To view all topical threads, click here.
Want to suggest a topic? Click here.
r/dataisbeautiful • u/oscarleo0 • 38m ago
r/dataisbeautiful • u/paveloush • 17h ago
r/dataisbeautiful • u/TeslaTorah • 3h ago
It’s not just about flexibility anymore. For the majority of American workers, remote work means being better employees and better pet parents.
r/dataisbeautiful • u/IdkJustPickSomething • 46m ago
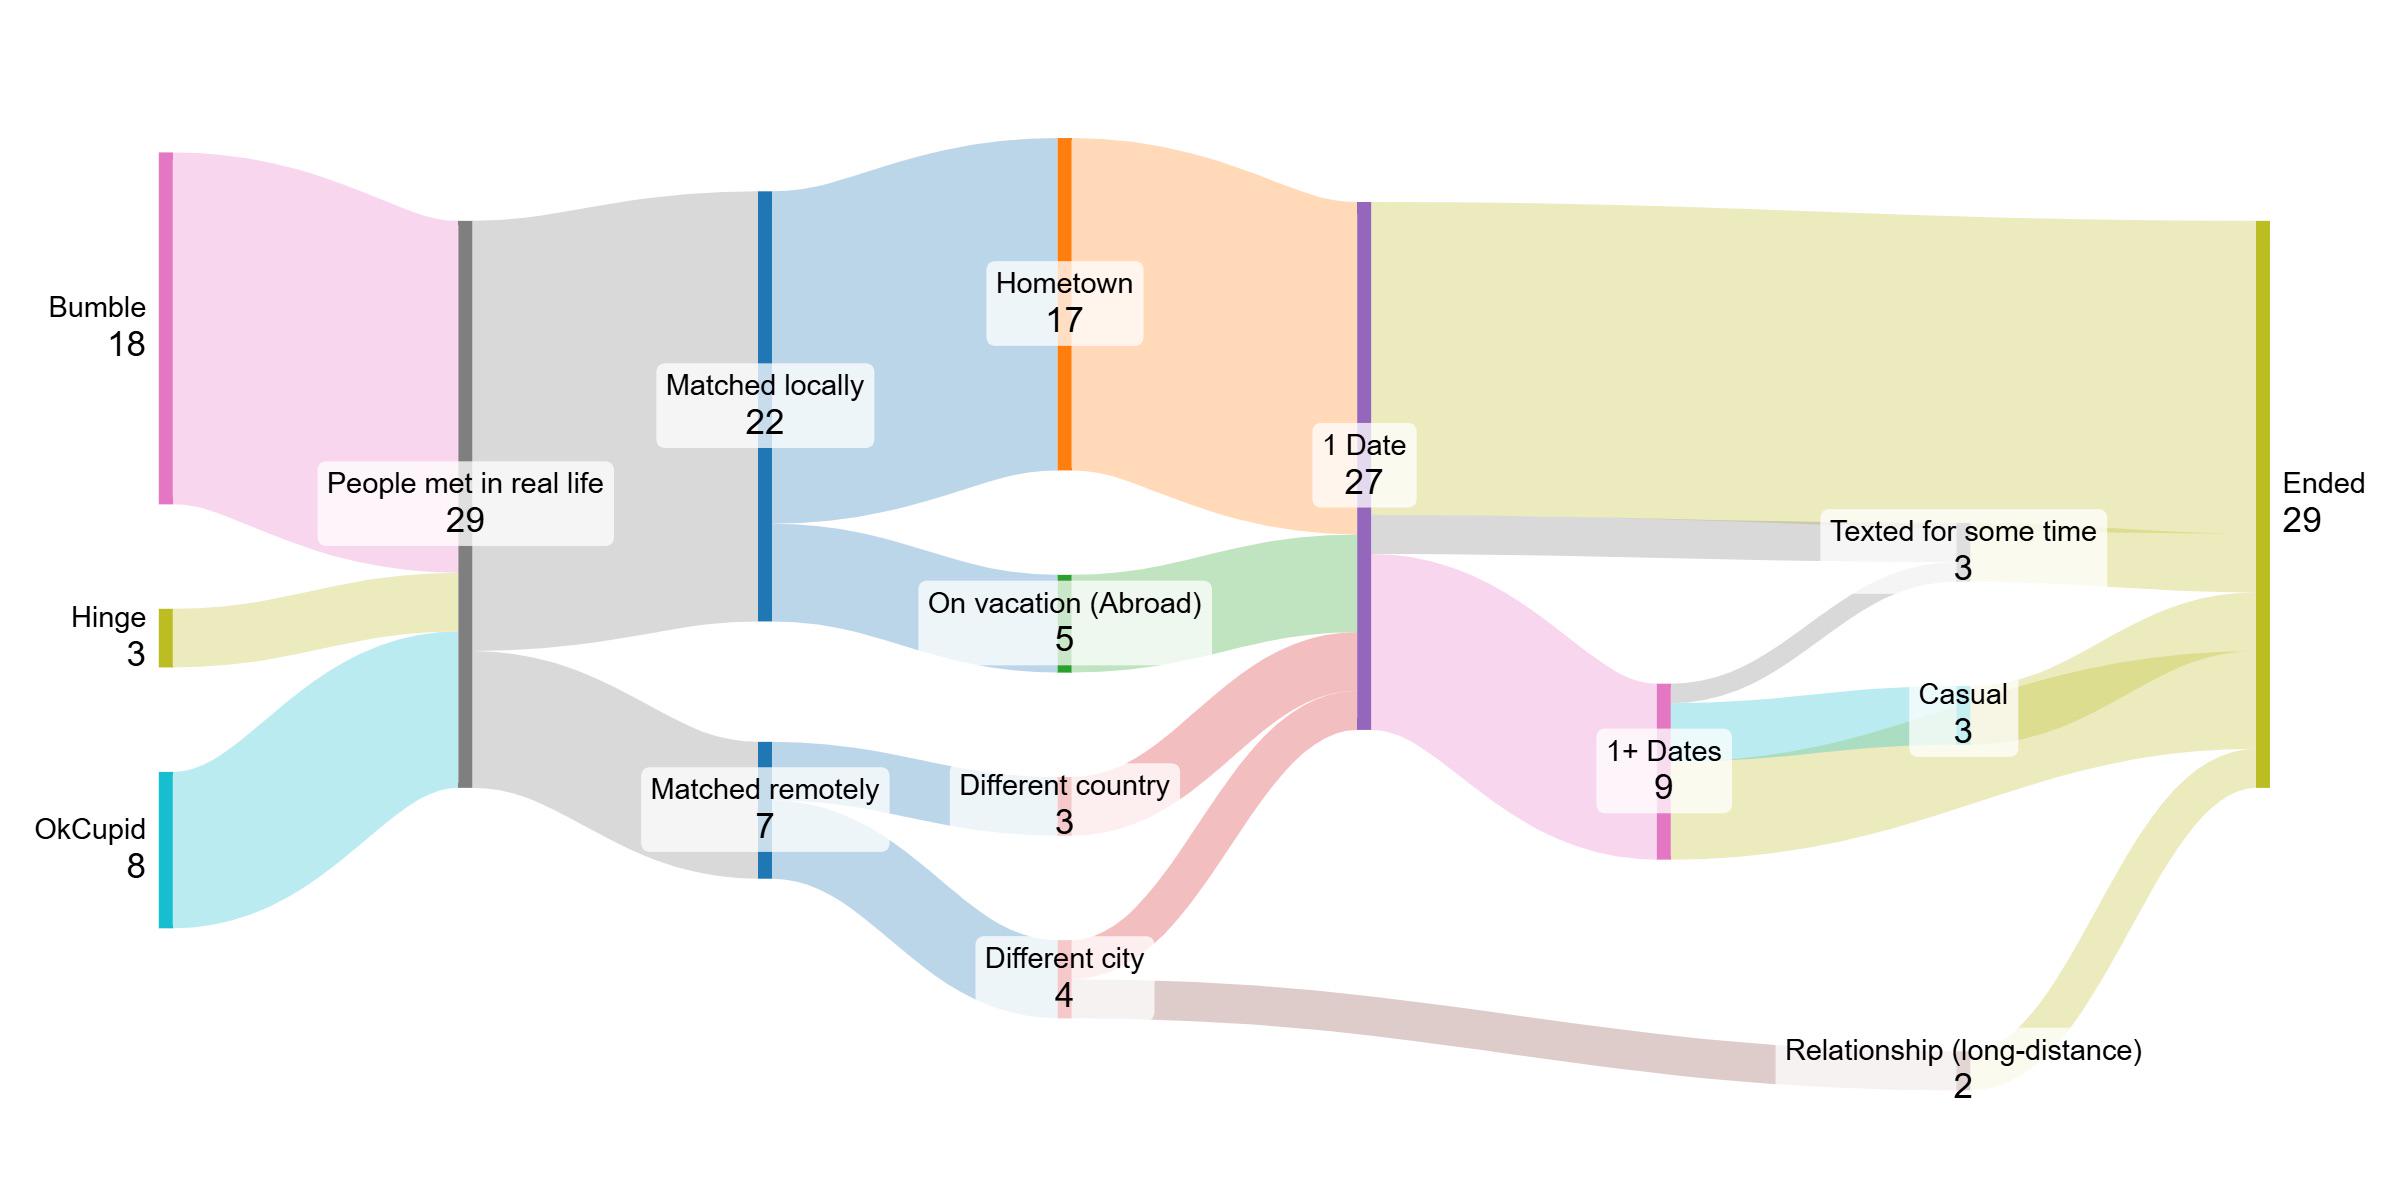
Trying this again when it's Monday for my [OC]. My data source was manually tracked expenses and categorized into SankeyMATIC.com I love a Sankey. Other graphs were from Excel. Please be kind if I made a mistake, I am a human.
My total headcount given was 79 adult guests, 96 with vendors and children (the math to count kids was weird). Honestly most of our guests were married couples, a few kids, and 4 single people total.
Sankey: We planned a wedding we wanted, not expecting anything from parents. We are very grateful of their unexpected contributions. *Most* of the contributions came with no strings attached, which was very stress free. Ask away, this is the bulk of the info!
Excel graphs:
We had very few no shows: one couple missed their flight and one plus one didn't show. One coworker randomly sent me $20 on venmo the morning of my wedding, so she's the "not invited" and man do I feel bad about not inviting her!
Day of, we had 2 gifts to take home. The rest were sent before or slightly after. Just a bunch of cards!
I excluded the monetary gifts noted on the left of the Sankey in an effort to not distort the data, so you could see how much was actually given by guests. As you can see, most cards represented two people (as mentioned, mostly couples), so the amount is how much was given by the couple. One 0 was the coworker who sent money, the other 0 was the no show couple (kept them on the list to send a thank you, since they tried).
I'm not sharing this to comment on the price of weddings in general, or any commentary on the wedding industry. Don't come at me for spending money that you wouldn't spend. I'm voluntarily sharing data, so don't judge my choices.
r/dataisbeautiful • u/WhySoTedious • 3h ago
r/dataisbeautiful • u/Sarquin • 1h ago
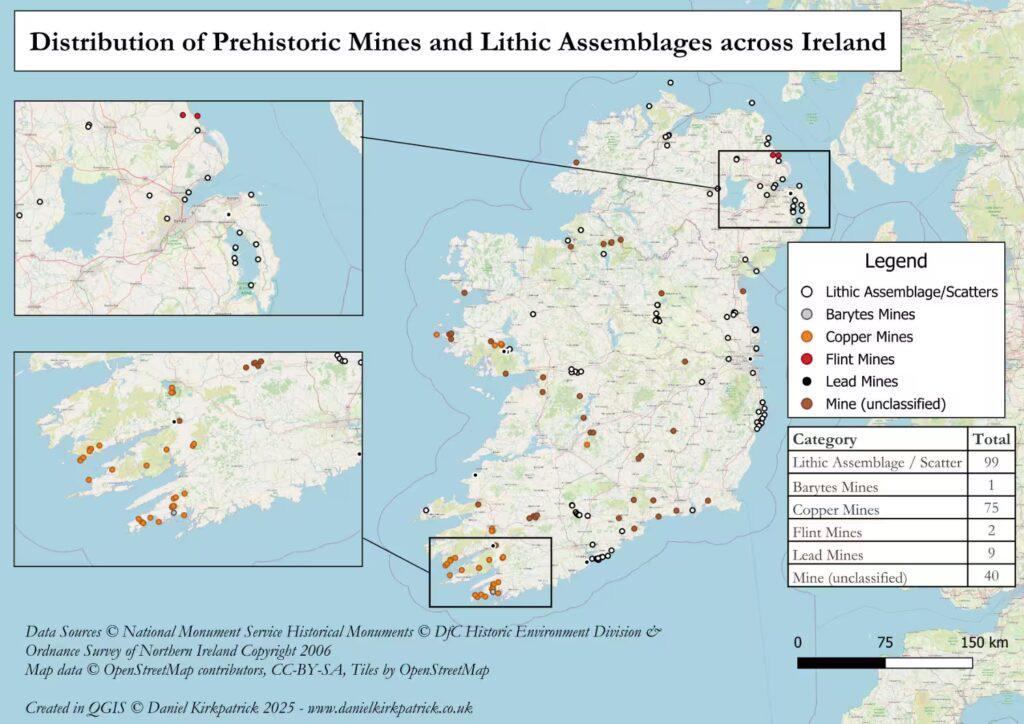
Using National Monument Service data for Ireland and Department for Communities data for Northern Ireland, here’s my attempt at mapping out prehistoric mine locations across the island. I’ve also added in lithic assemblages as a possible proxy for flint locations though appreciate that’s more of a stretch.
It’s worth noting that the DfC data (Northern Ireland) doesn’t include the same breakdown for mine locations so it’s not a like for like comparison.
The map was built using some PowerQuery transformations and then designed in QGIS. I’m still learning so this is just my latest attempt and hopefully they’ll keep getting better.
Feedback always welcome.
r/dataisbeautiful • u/jargs92 • 1h ago
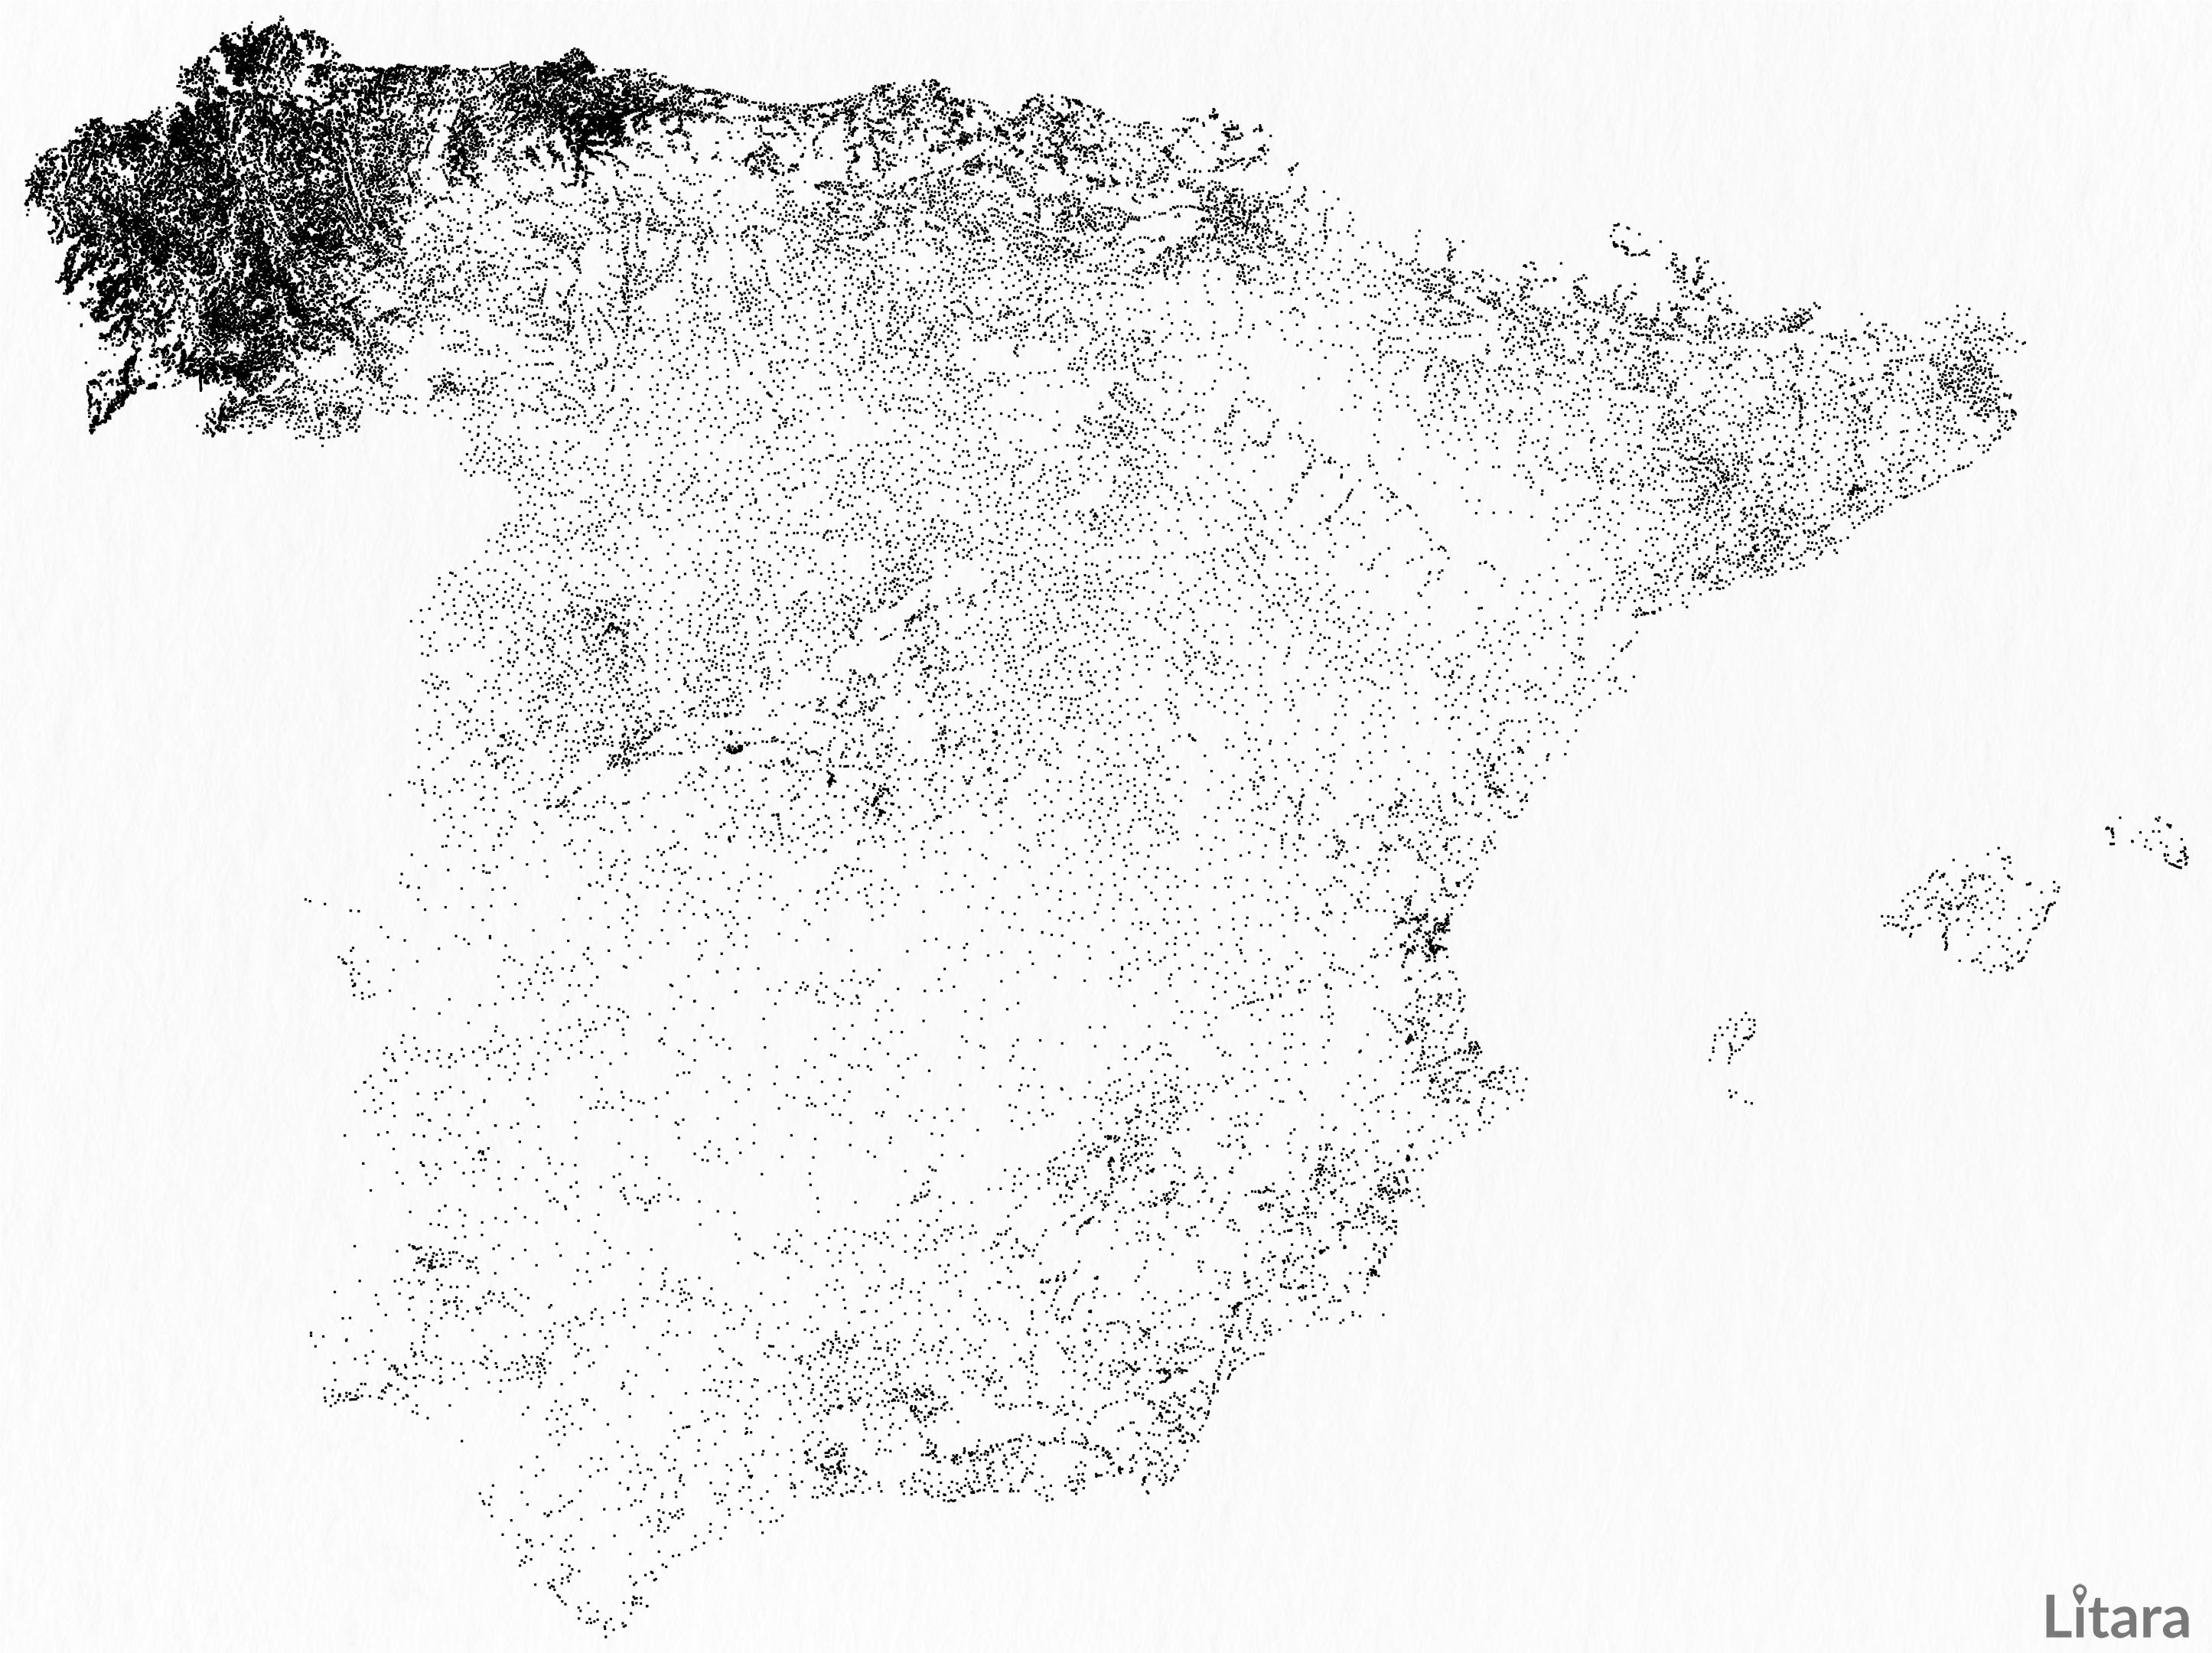
I created an interactive map of the entire corpus of cancer research from 2010 to 2025, representing ~ 2.5 million papers. The map is based on the titles and abstracts of papers, which were embedded using a transformer neural network, projected with UMAP, and clustered with Leiden.
The atlas is available for full exploration on my website: https://www.litletter.net/cancer-atlas, where you can zoom into any area of the atlas, and click on paper titles to read them
There are 46 distinct communities, each representing a core area of focus within the field.
These clusters span the breadth of cancer research, including:
r/dataisbeautiful • u/oscarleo0 • 1d ago
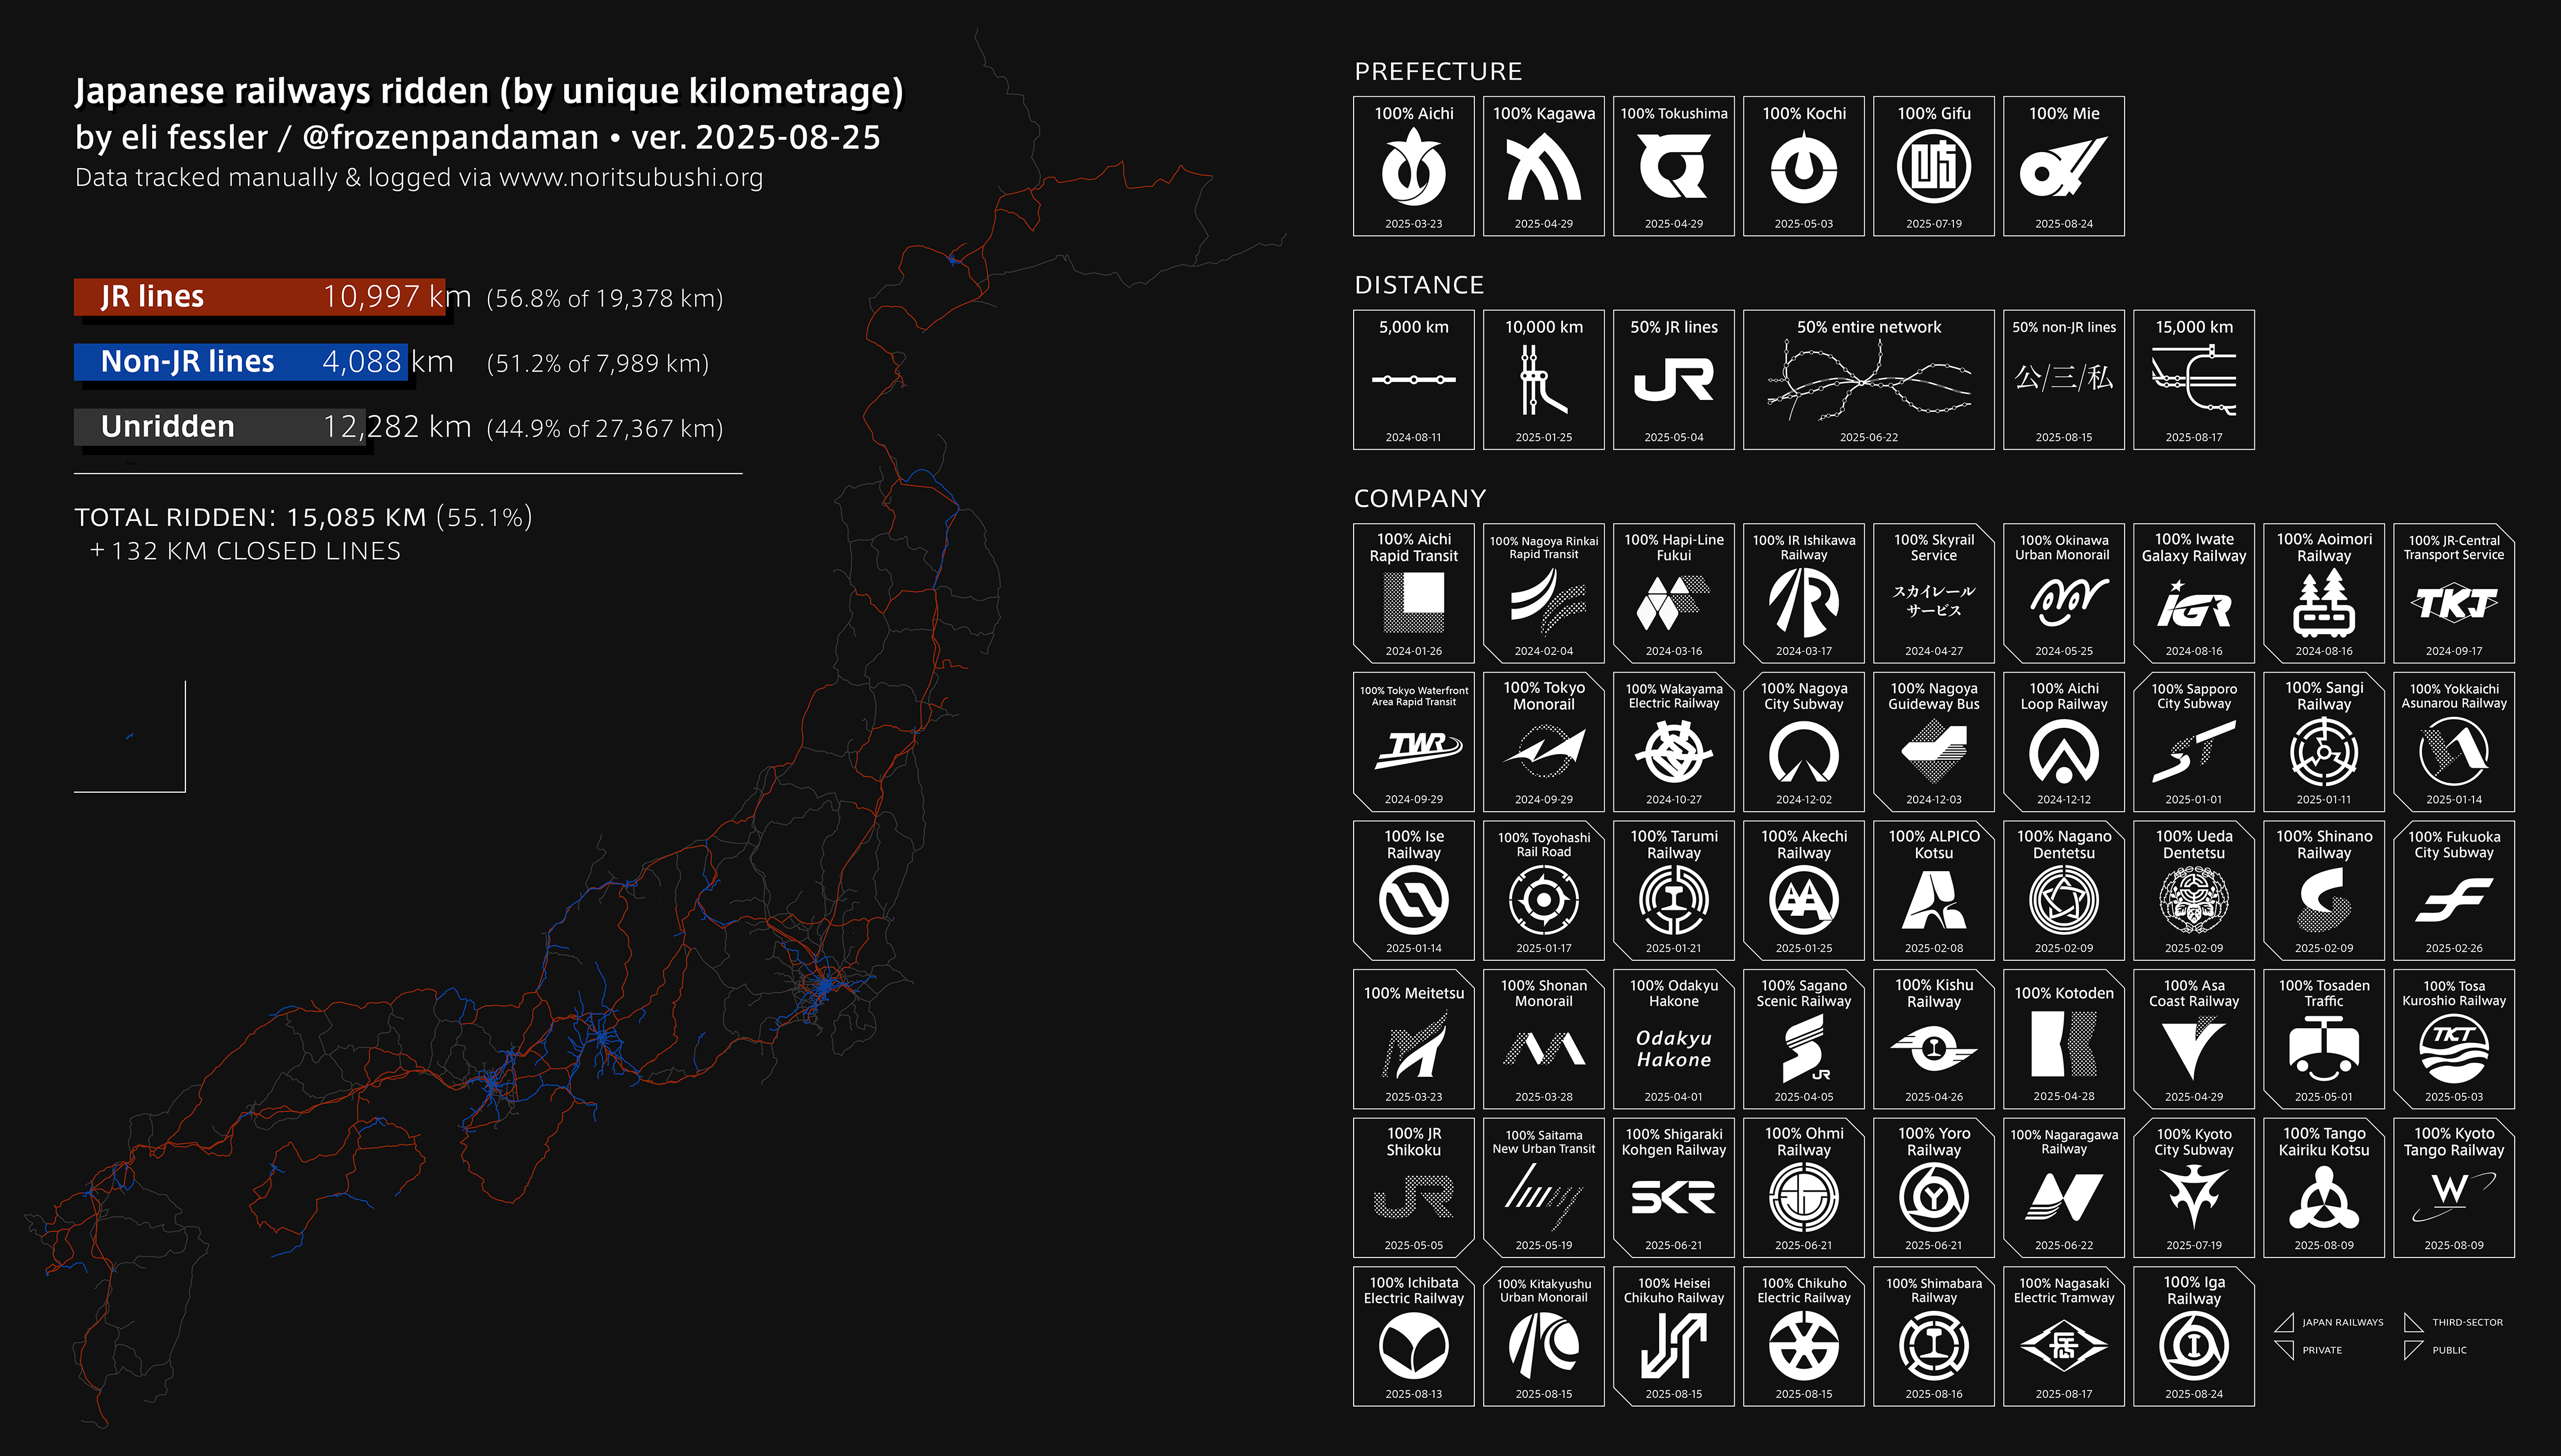
r/dataisbeautiful • u/frozenpandaman • 15m ago
I tend to think the prefectural symbols (used on flags) and railway company logos are both pretty cool-looking, heavily based on – or sometimes directly taken from – [kamon](https://en.wikipedia.org/wiki/Mon(emblem))_, emblems used by families and clans beginning in the Heian period and throughout Feudal & Early Modern Japan. Besides updating the map with some new milestones, I decided to show the prefectures, major distance markers, and companies that I've "completed" as well. Figured people might enjoy looking through the various symbols!
r/dataisbeautiful • u/be_data • 51m ago
r/dataisbeautiful • u/Luton_Enjoyer • 23h ago
r/dataisbeautiful • u/birdbirdeos • 21m ago
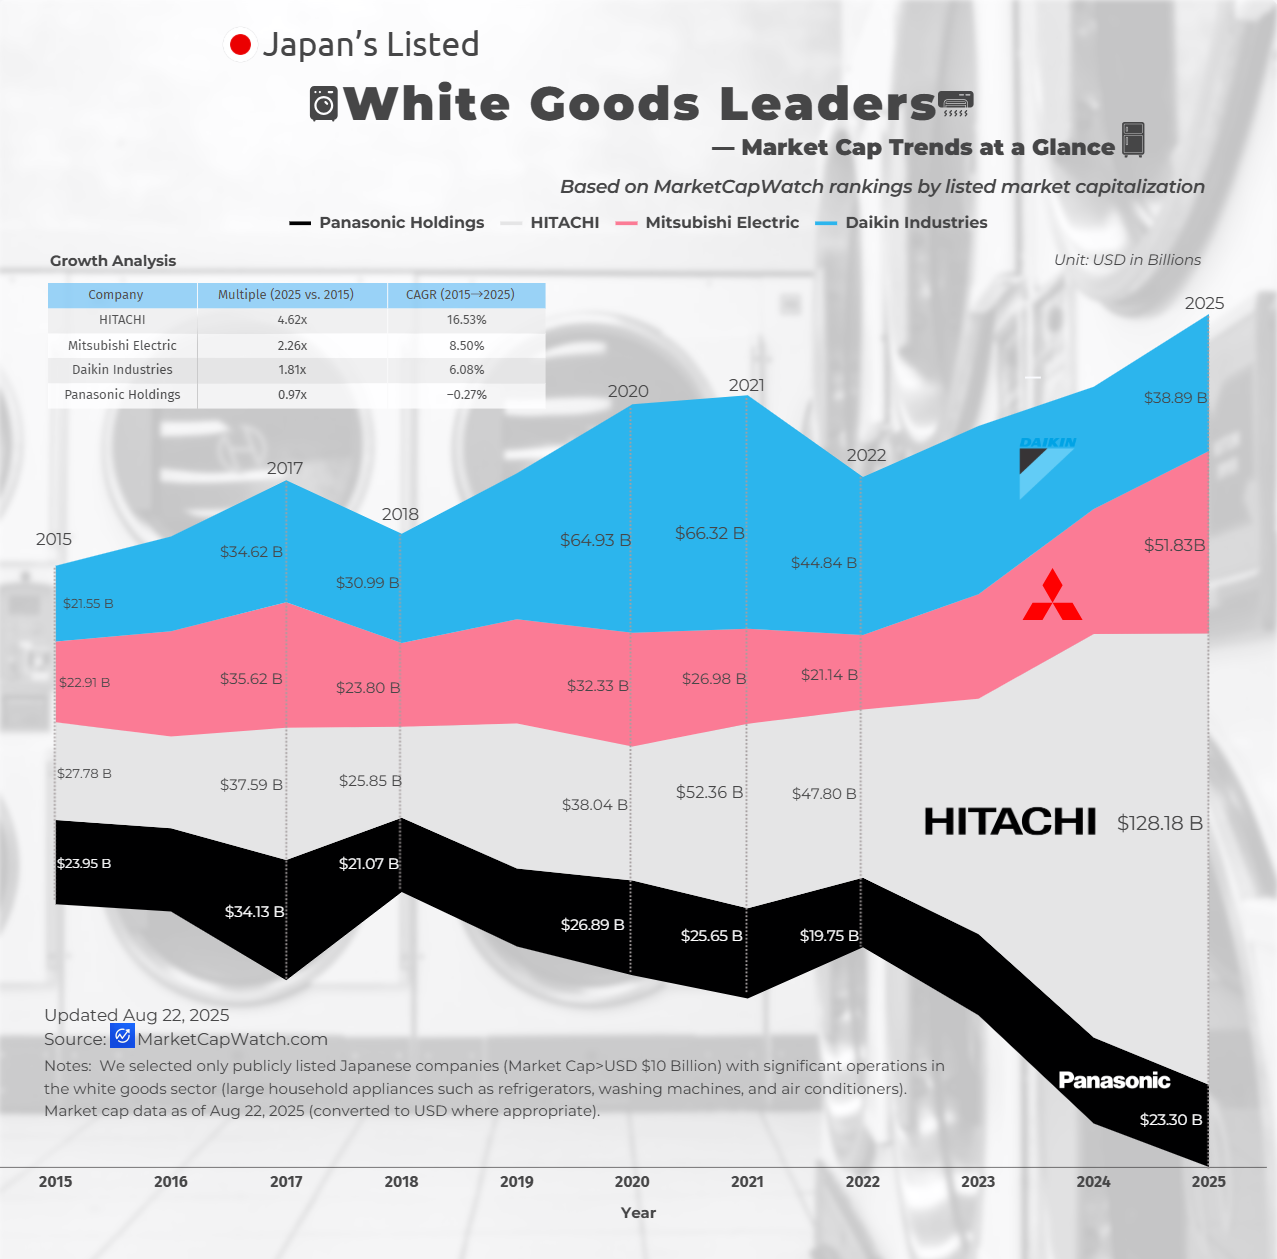
r/dataisbeautiful • u/Proud-Discipline9902 • 6h ago
Data Sources: Market Capitalization: Sourced from MarketCapWatch.
We selected only publicly listed Japanese companies (Market Cap>USD $10 Billion) with significant operations in the white goods sector (large household appliances such as refrigerators, washing machines, and air conditioners). Market cap data as of Aug 22, 2025 (converted to USD where appropriate).
FAQ — Understanding This Chart
Q1: Why isn’t Sony included? Sony’s core business is in consumer electronics, gaming, entertainment, and financial services. It does not operate at scale in the white goods category (large household appliances like fridges, washing machines, ovens, and air conditioners), so it falls outside the scope of this chart.
Q2: Why isn’t Toshiba included? Toshiba was delisted from the Tokyo Stock Exchange in December 2023 after a buyout and is now privately held. Because our dataset only covers publicly listed companies, Toshiba is excluded.
Q3: What exactly counts as “white goods” in this analysis? We define white goods as large household appliances for cooling, cleaning, and cooking — e.g., refrigerators, washing machines, ovens, dishwashers, and air conditioners. Companies must have significant sales in these product categories to qualify.
Q4: Why are companies mainly HVAC specialists (e.g., Daikin) included? HVAC products — particularly large air conditioning systems — fall under the “white goods” umbrella in many industry classifications. Companies with significant domestic appliance presence in HVAC are included if they are publicly listed in Japan.
Q5: Why does the market cap vary so much between companies? Some giants (like Hitachi or Mitsubishi Electric) are diversified conglomerates with revenue streams far beyond appliances.
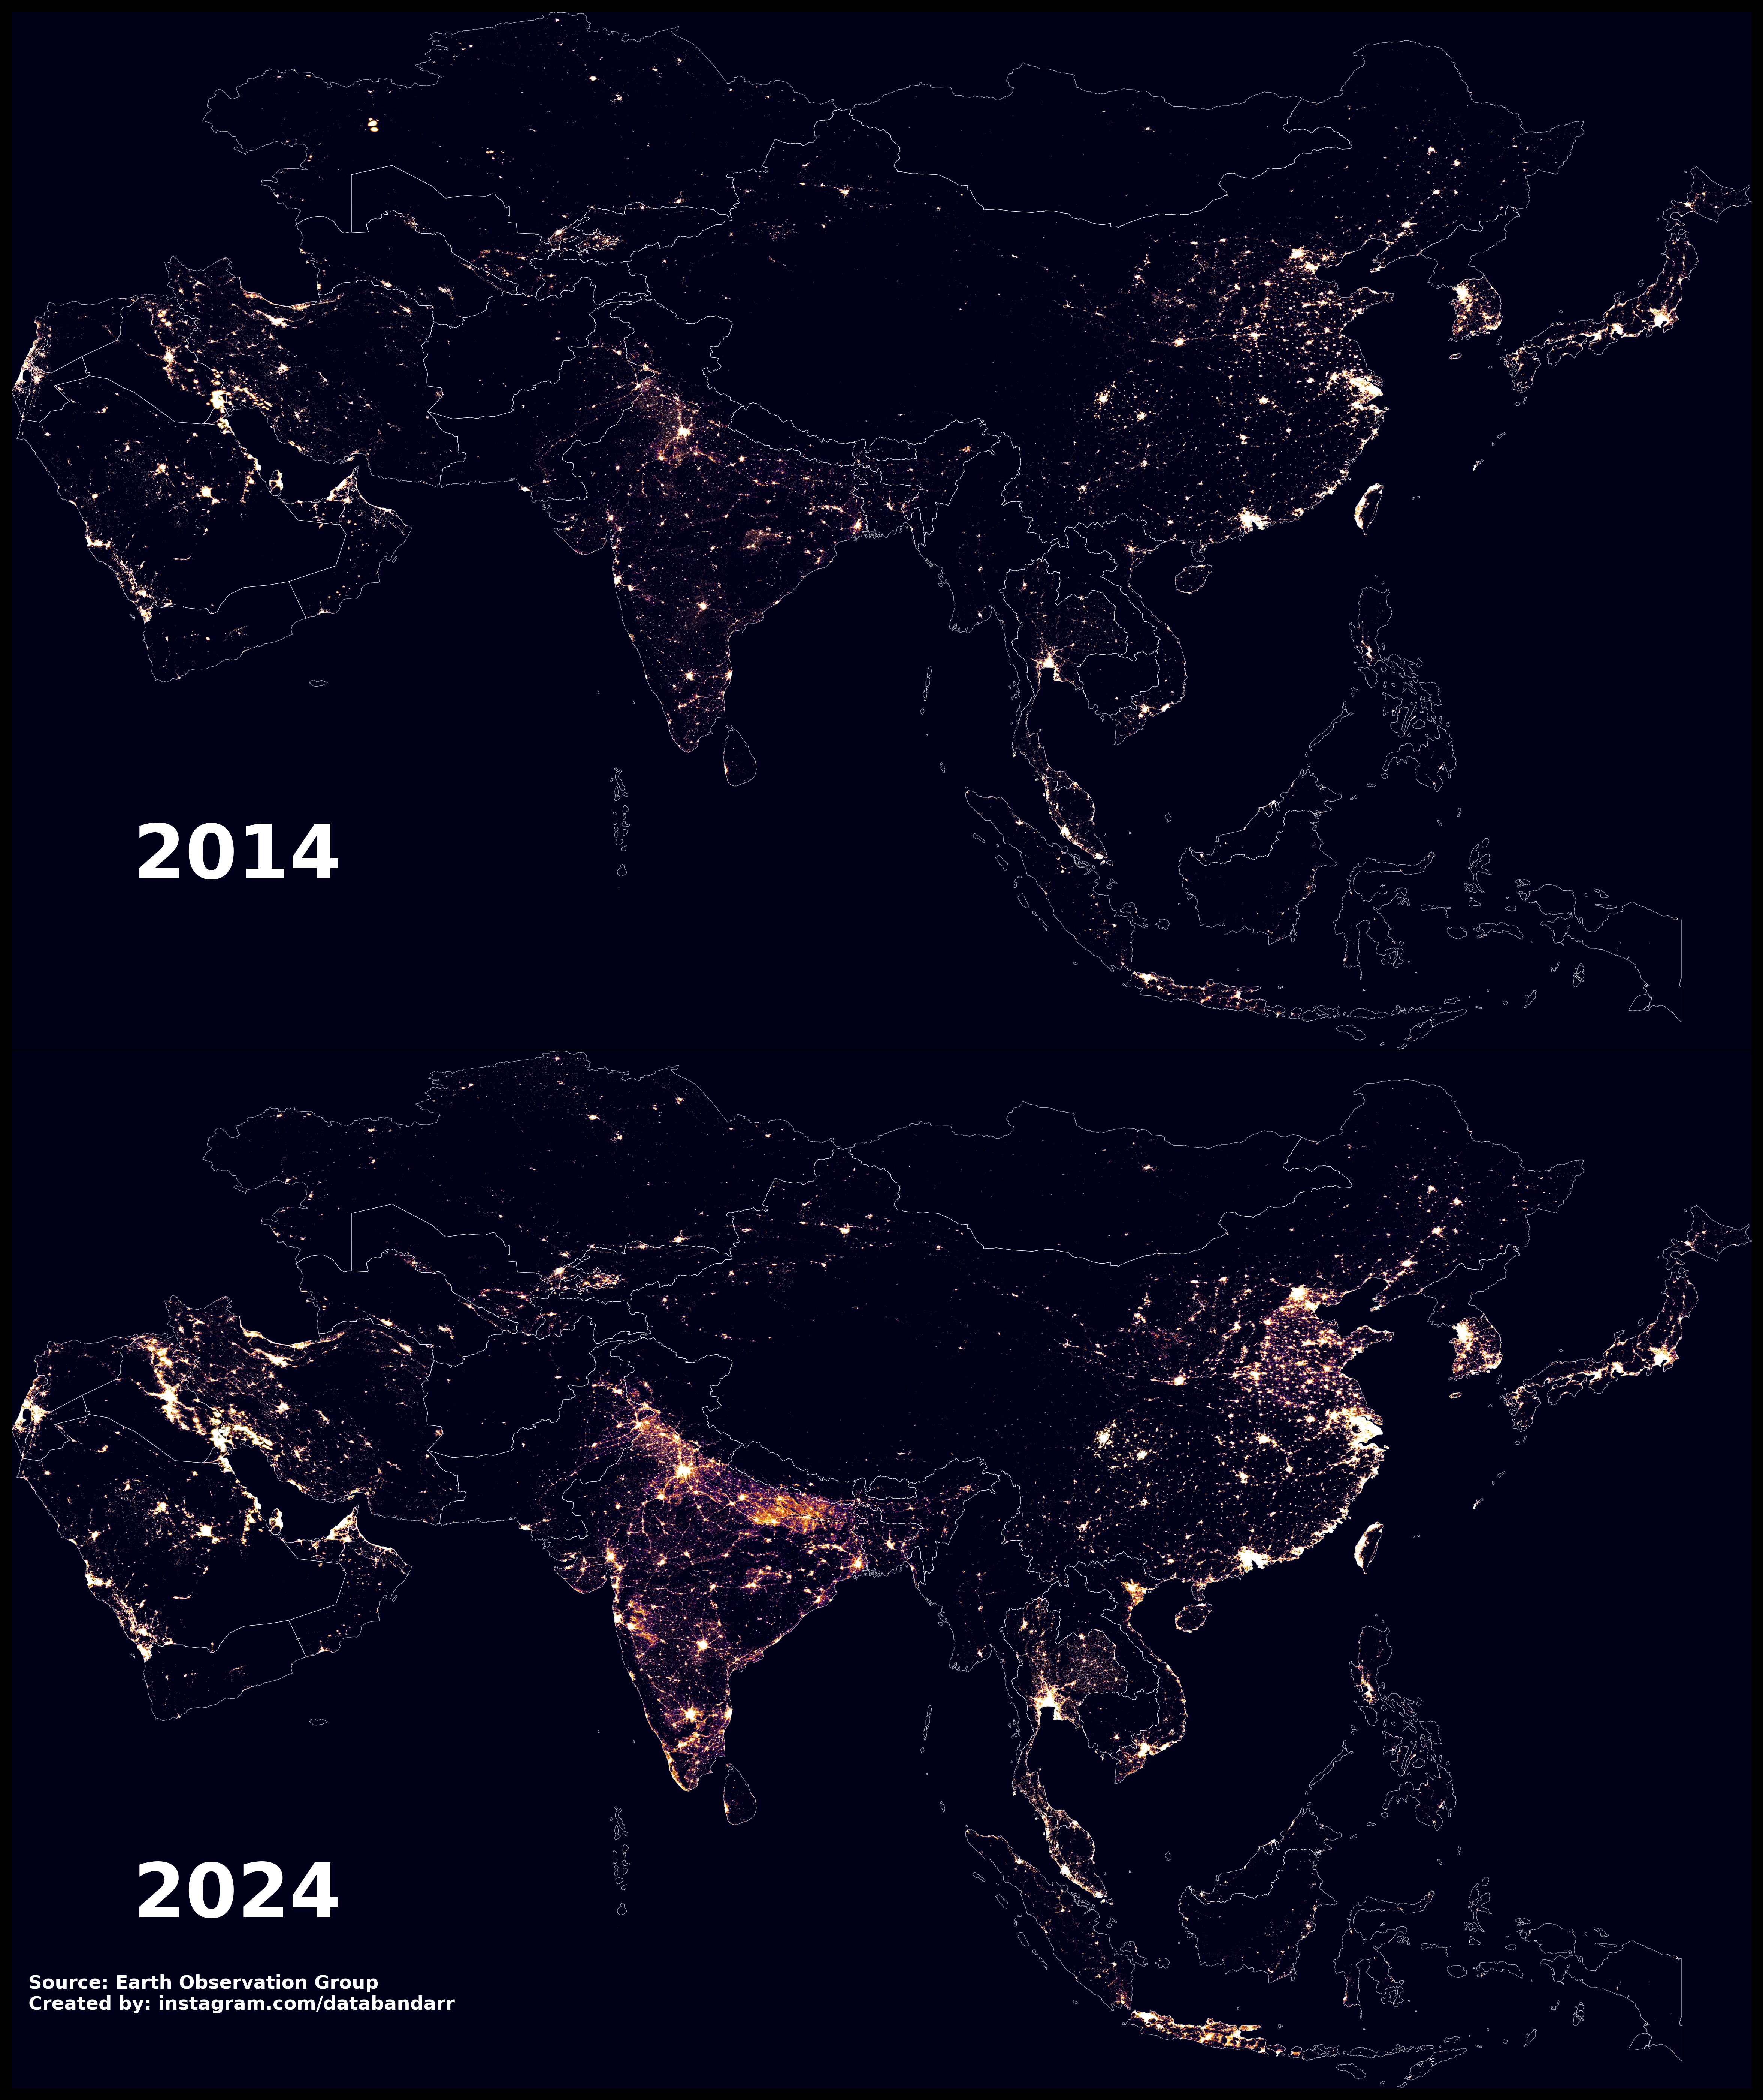
r/dataisbeautiful • u/ramnamsatyahai • 2d ago
Reposting with updated data , the 2012 composite used a different method and partial coverage, which made some regions (like Thailand) appear darker. This version uses average annual masked VIIRS data for a fairer 2014–2024 comparison.
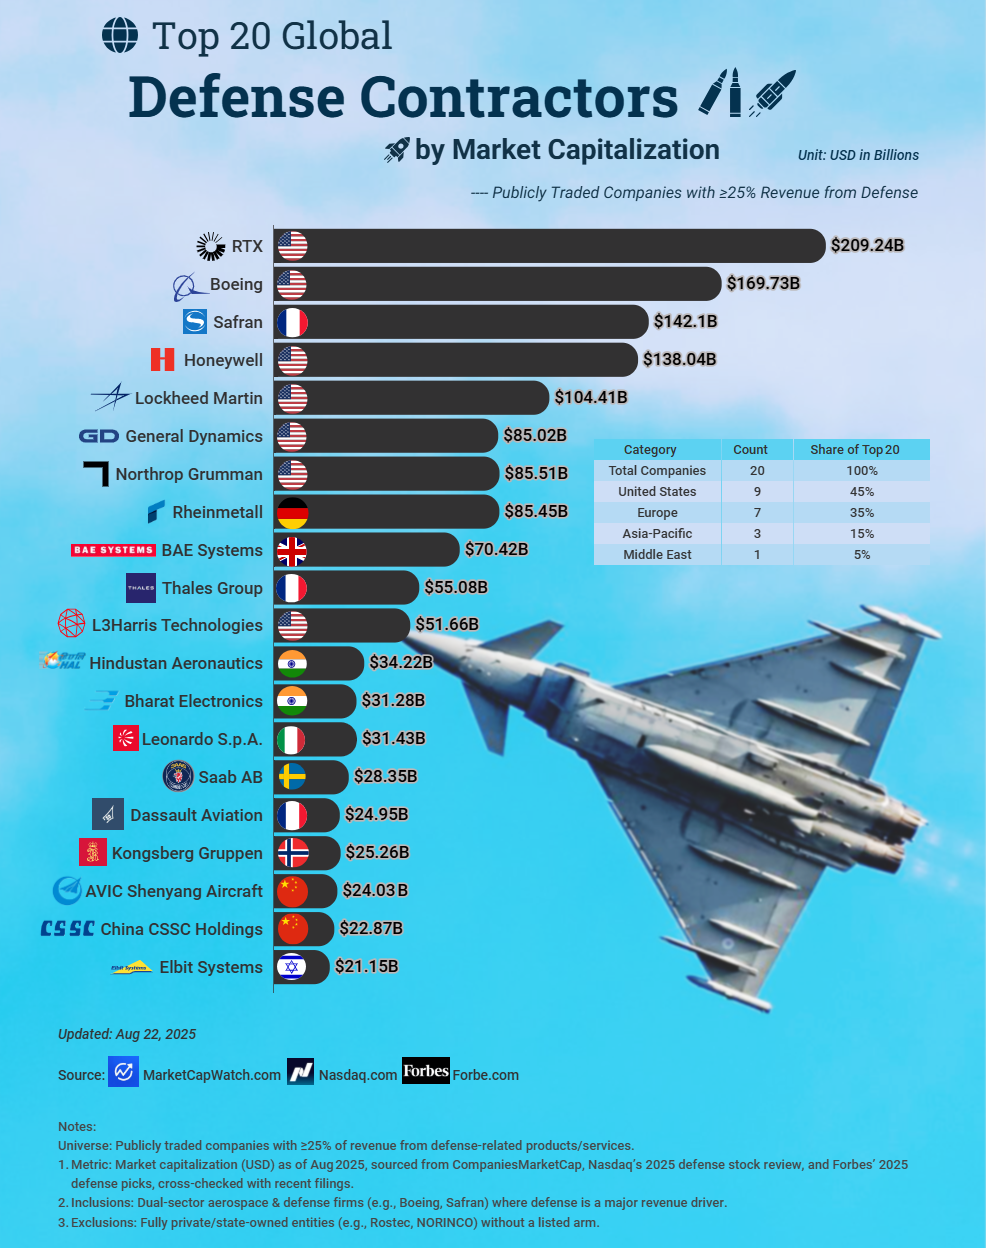
r/dataisbeautiful • u/Proud-Discipline9902 • 2d ago
Methodology & scope:
r/dataisbeautiful • u/willkoeppen • 2d ago
This animation shows water levels on the upper Guadalupe River from midnight July 4, 2025, to 6 p.m. July 5 (local time). The flood killed 119 people in Kerr County, including 25 girls and two teenage counselors at Camp Mystic.
Data sources
Tools:
Interactive version with contextual information: https://www.willkoeppen.com/datavis/guadalupe-floods/
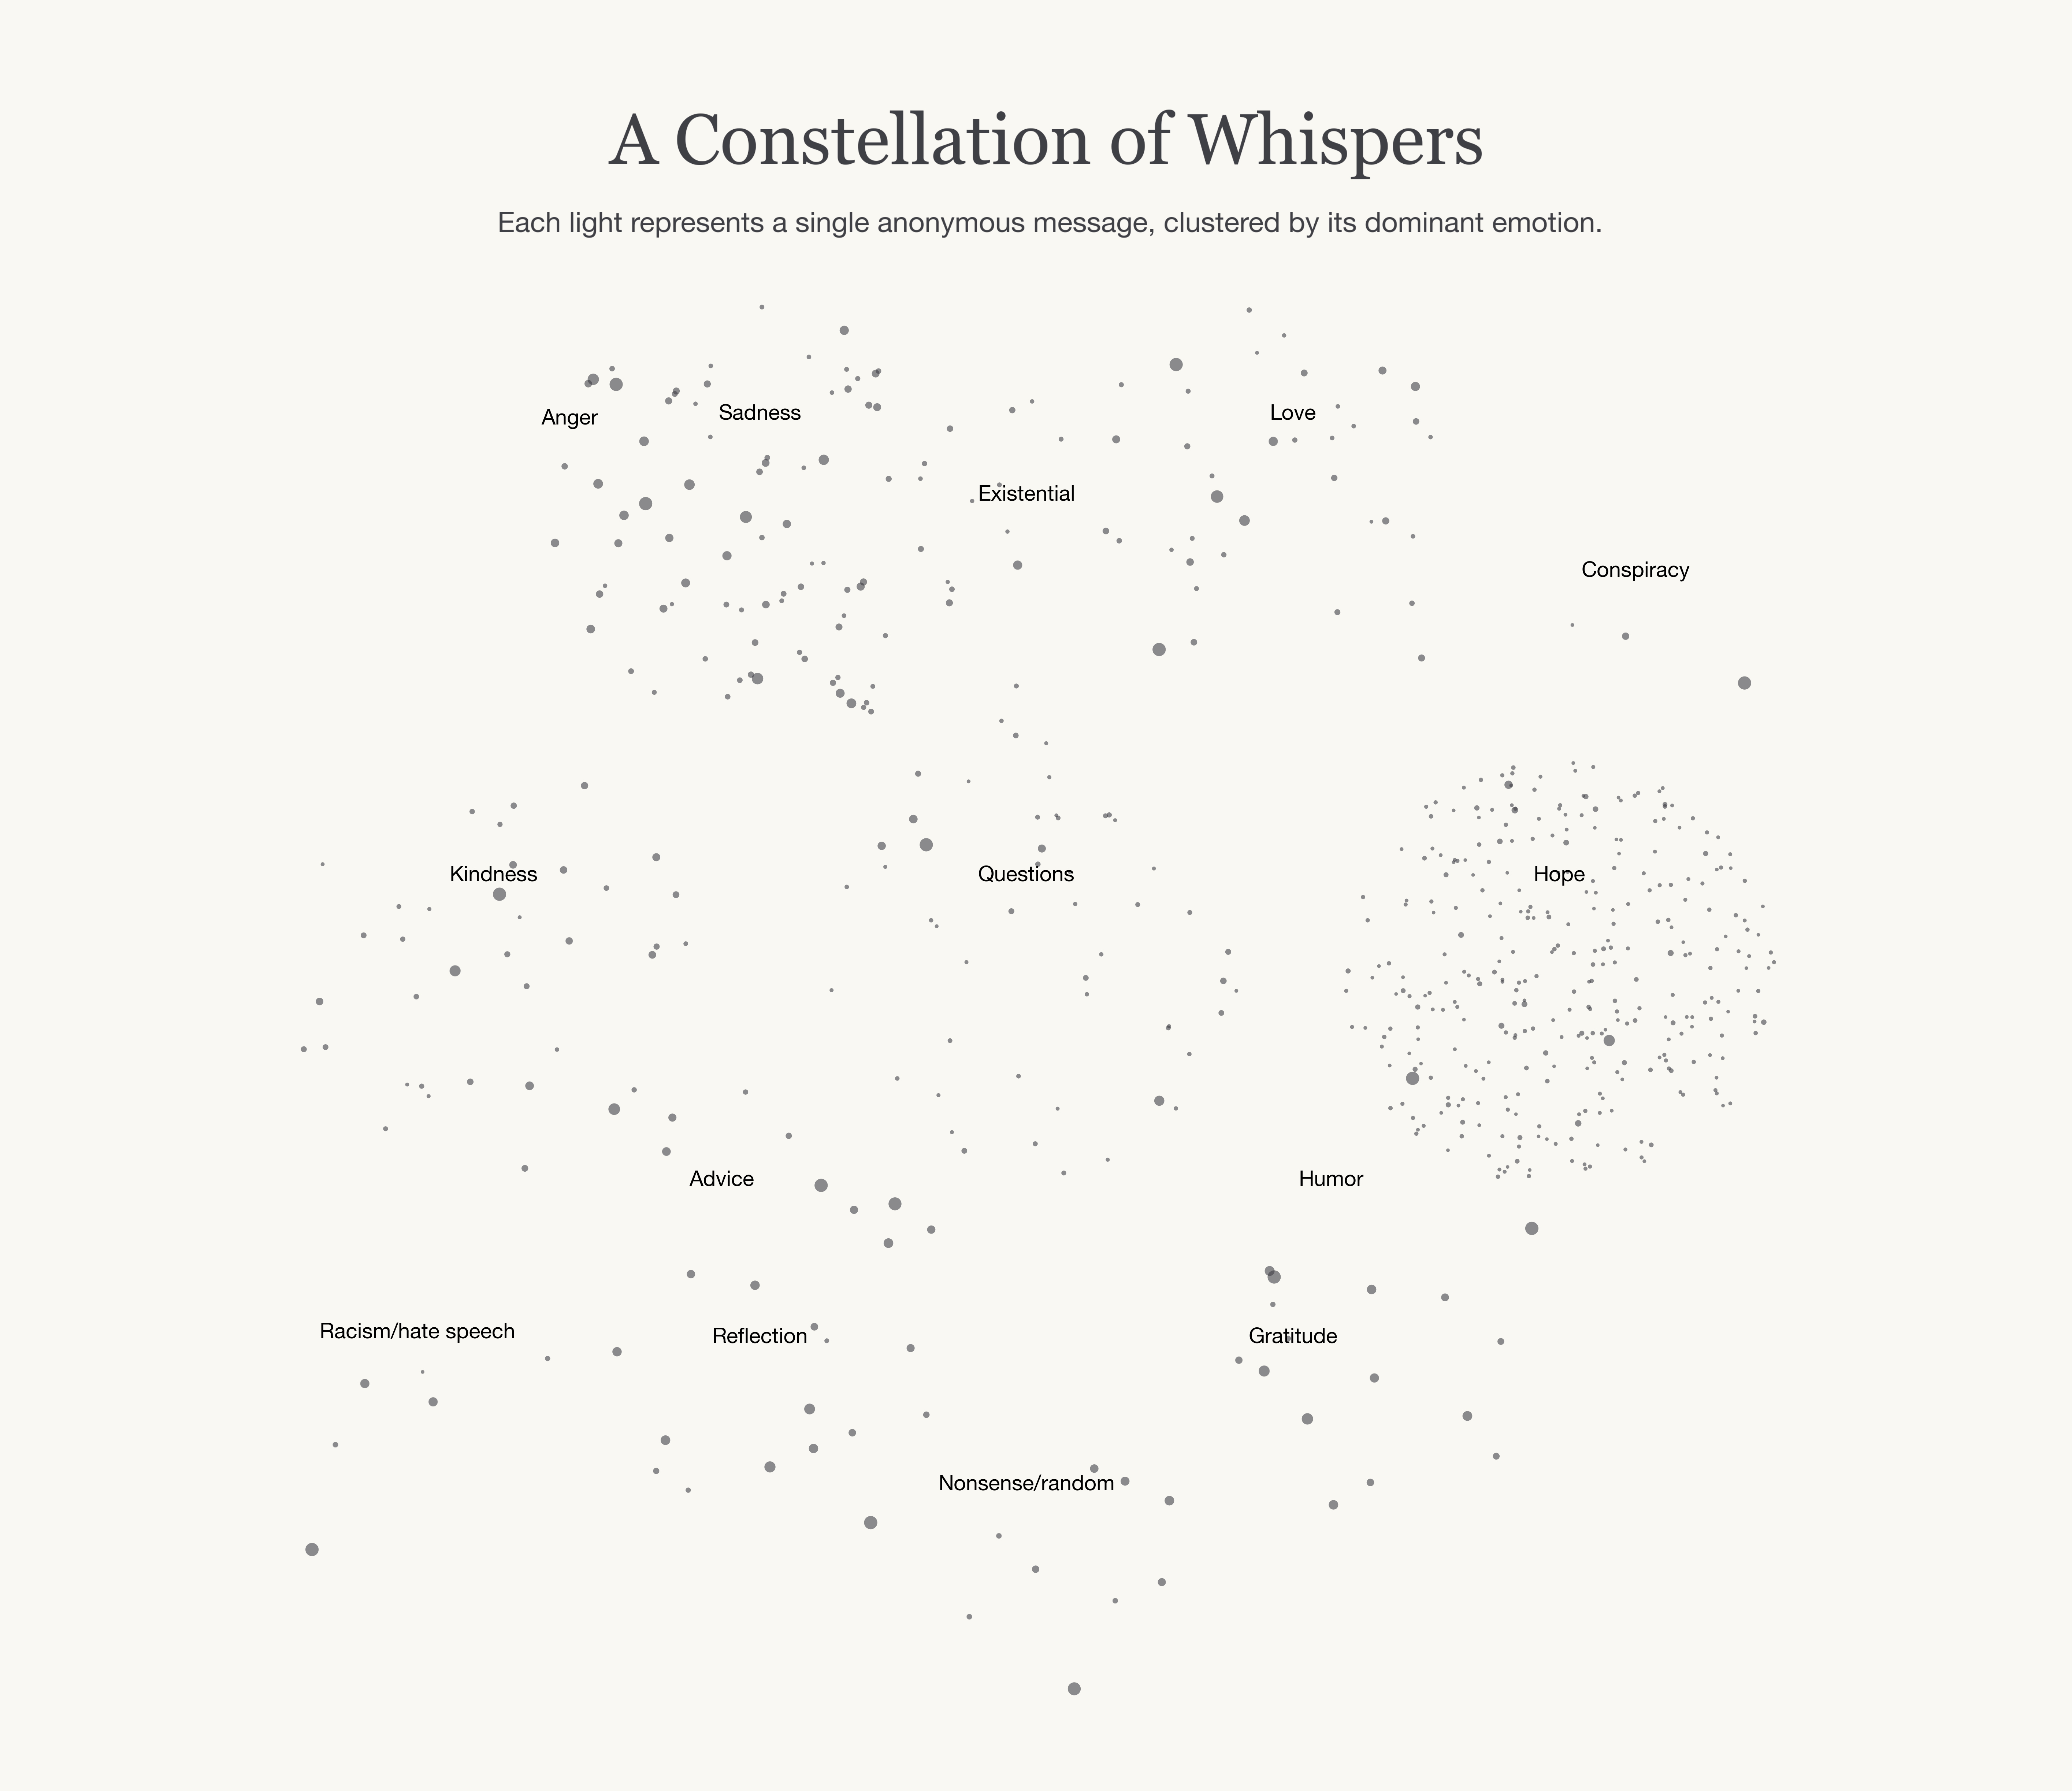
r/dataisbeautiful • u/TheHonestRedditer • 2d ago
Data source: Collected from my web app Daylettr, where users anonymously write one daily note for the next user and receive a random one from the previous one. This captures raw human thoughts under guaranteed anonymity (no logins, no tracking). Full dataset: 1548 messages
Tools: Python (pandas for processing, seaborn/matplotlib for visualization). Emotions classified via keyword matching (e.g., 'hope' for words like 'hope', 'better'; expandable for nuance).
Insights: Anonymity seems to encourage positivity (even if it seems that it might do the opposite), over 60% of messages fall into uplifting categories like kindness, gratitude, and hope. But there's depth: reflection dominates when people ponder life, with rare but raw sadness or humor peeking through. It shows humanity's spectrum: supportive yet vulnerable.
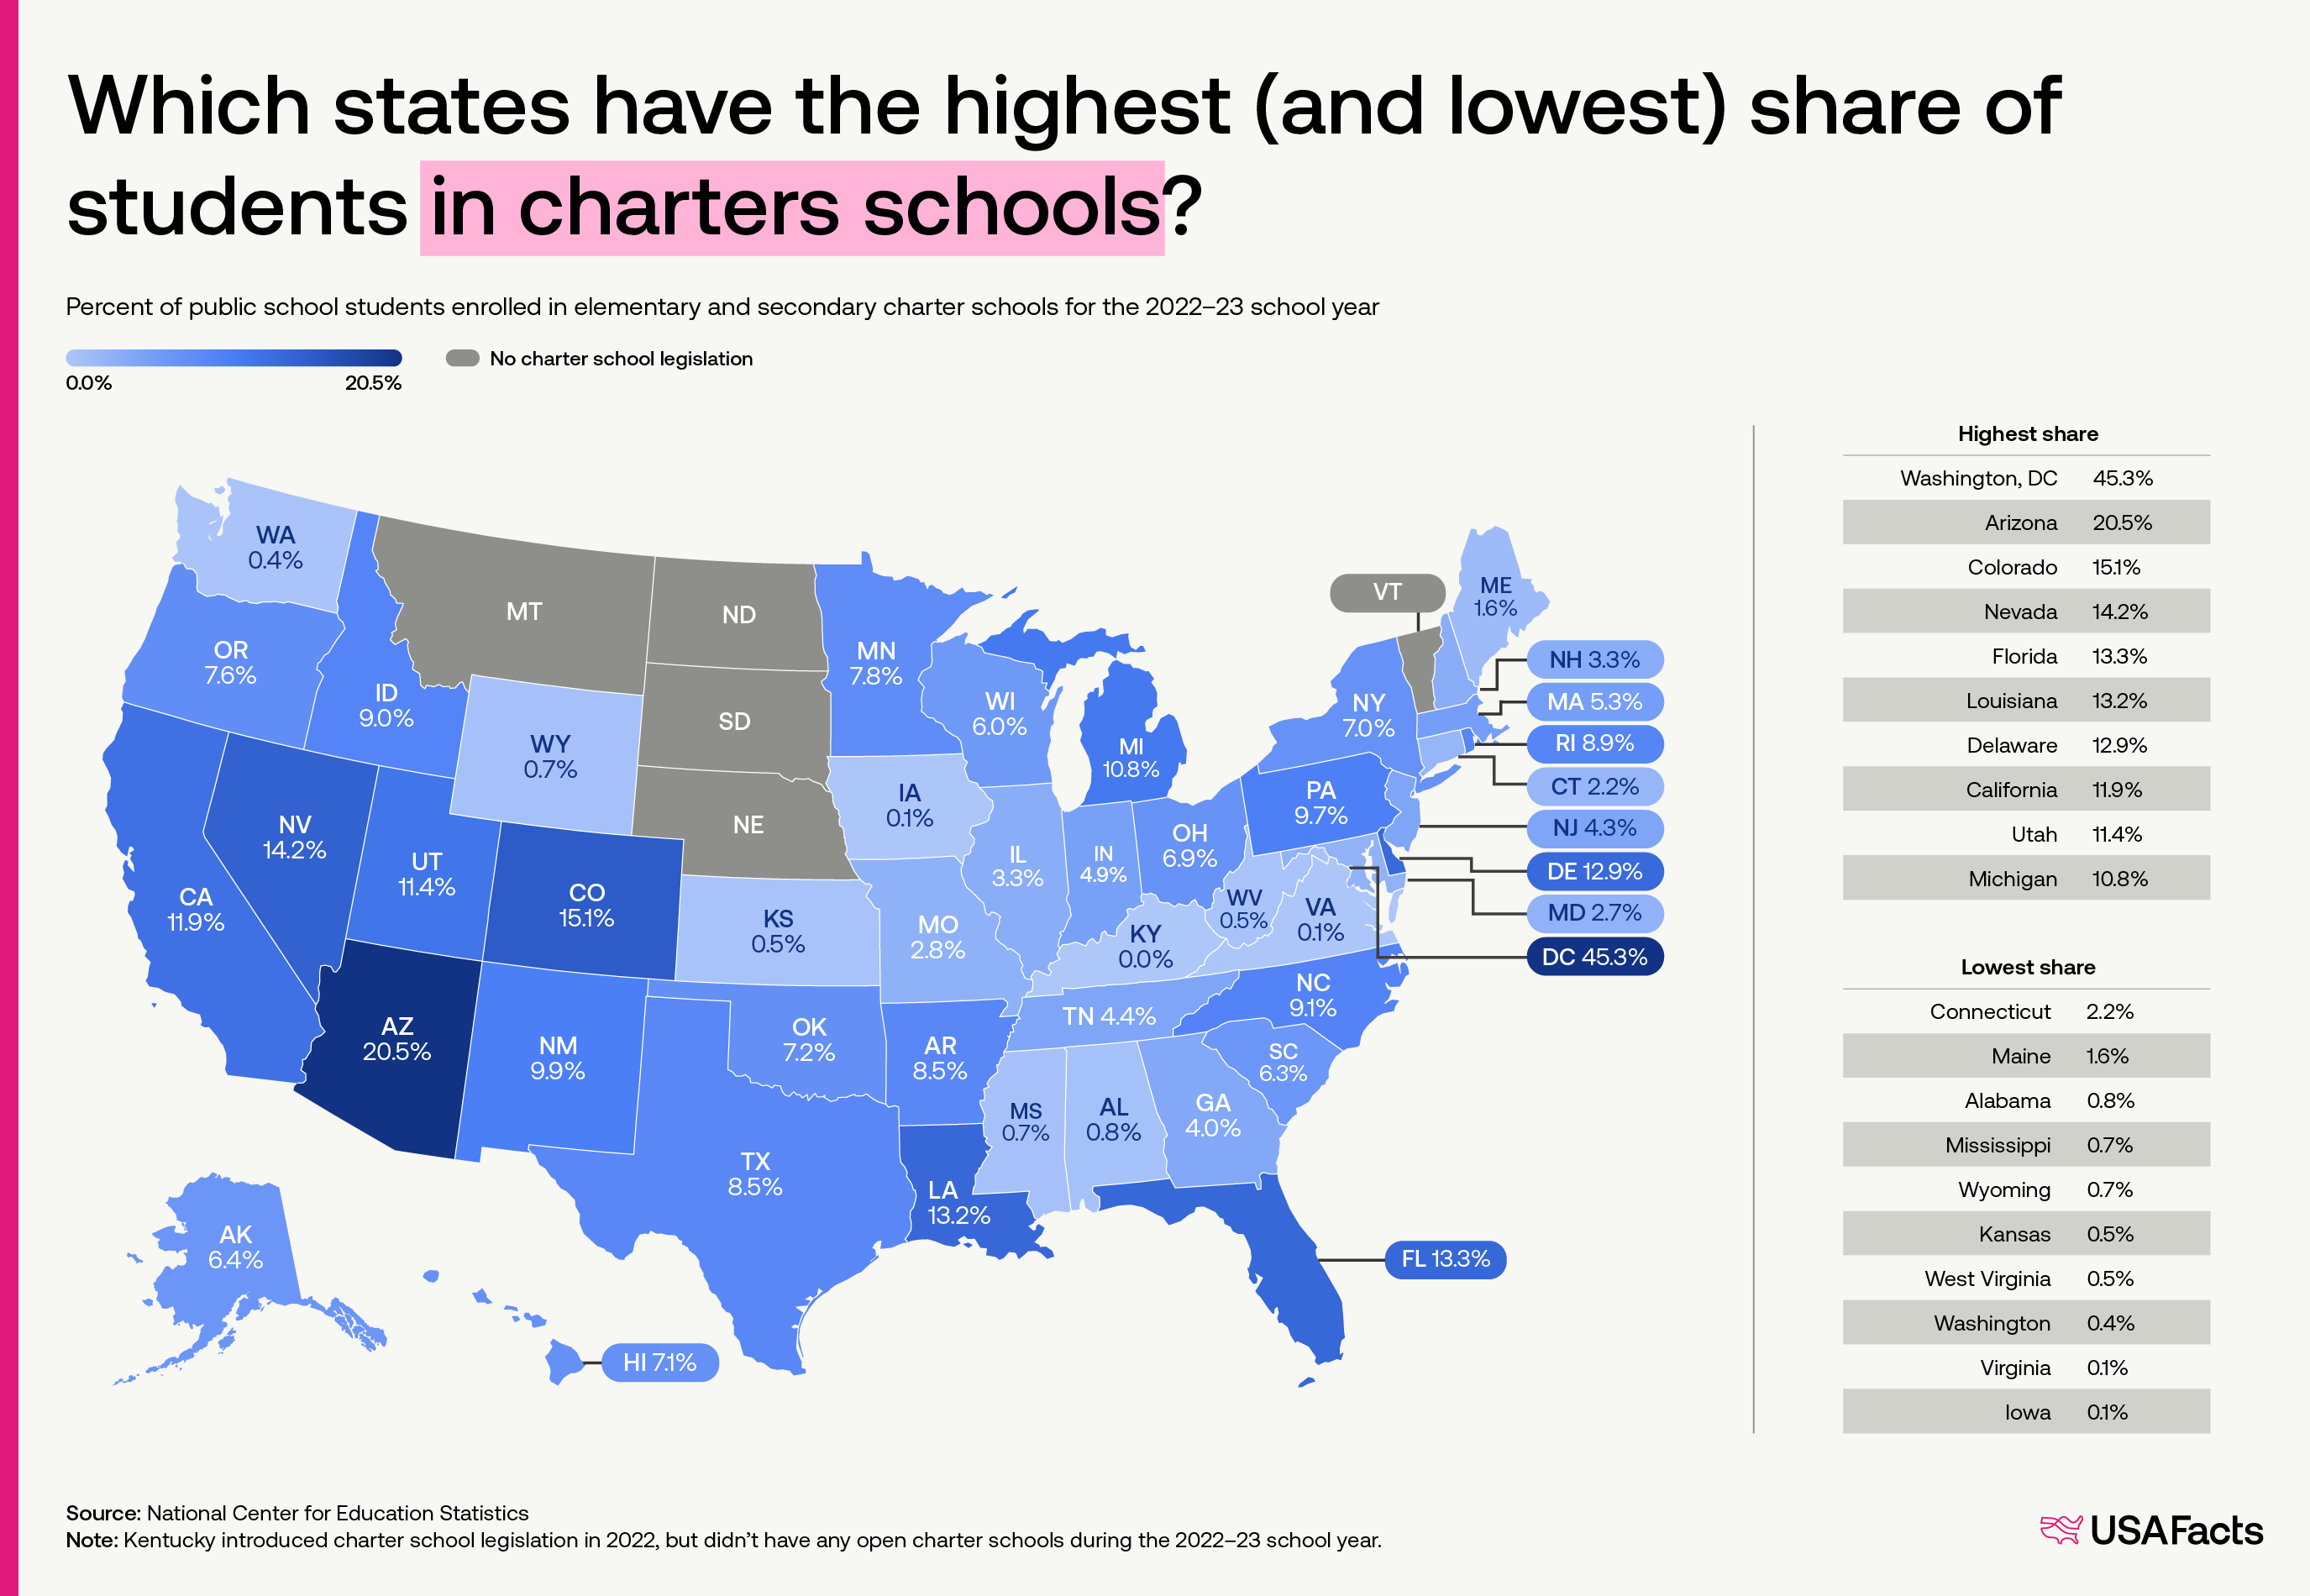
r/dataisbeautiful • u/USAFacts • 2d ago
r/dataisbeautiful • u/haydendking • 2d ago
r/dataisbeautiful • u/FluidModeNetwork • 22h ago
My sheets document includes the sources, but the ranking uses 13 different sources. Sadly, not every country is included in every source so you will see blank spaces for countries that are left out in the data. I've also created a correlation index to see how different metrics matched up with each other and you can see the data I used for each ranking.
https://docs.google.com/spreadsheets/d/1YbfVevxEthNgDtK69P48Xm39bXLHi8eqfeFwxTTYEJE/edit?usp=sharing
Hope you like it, lemme know if you have any questions.
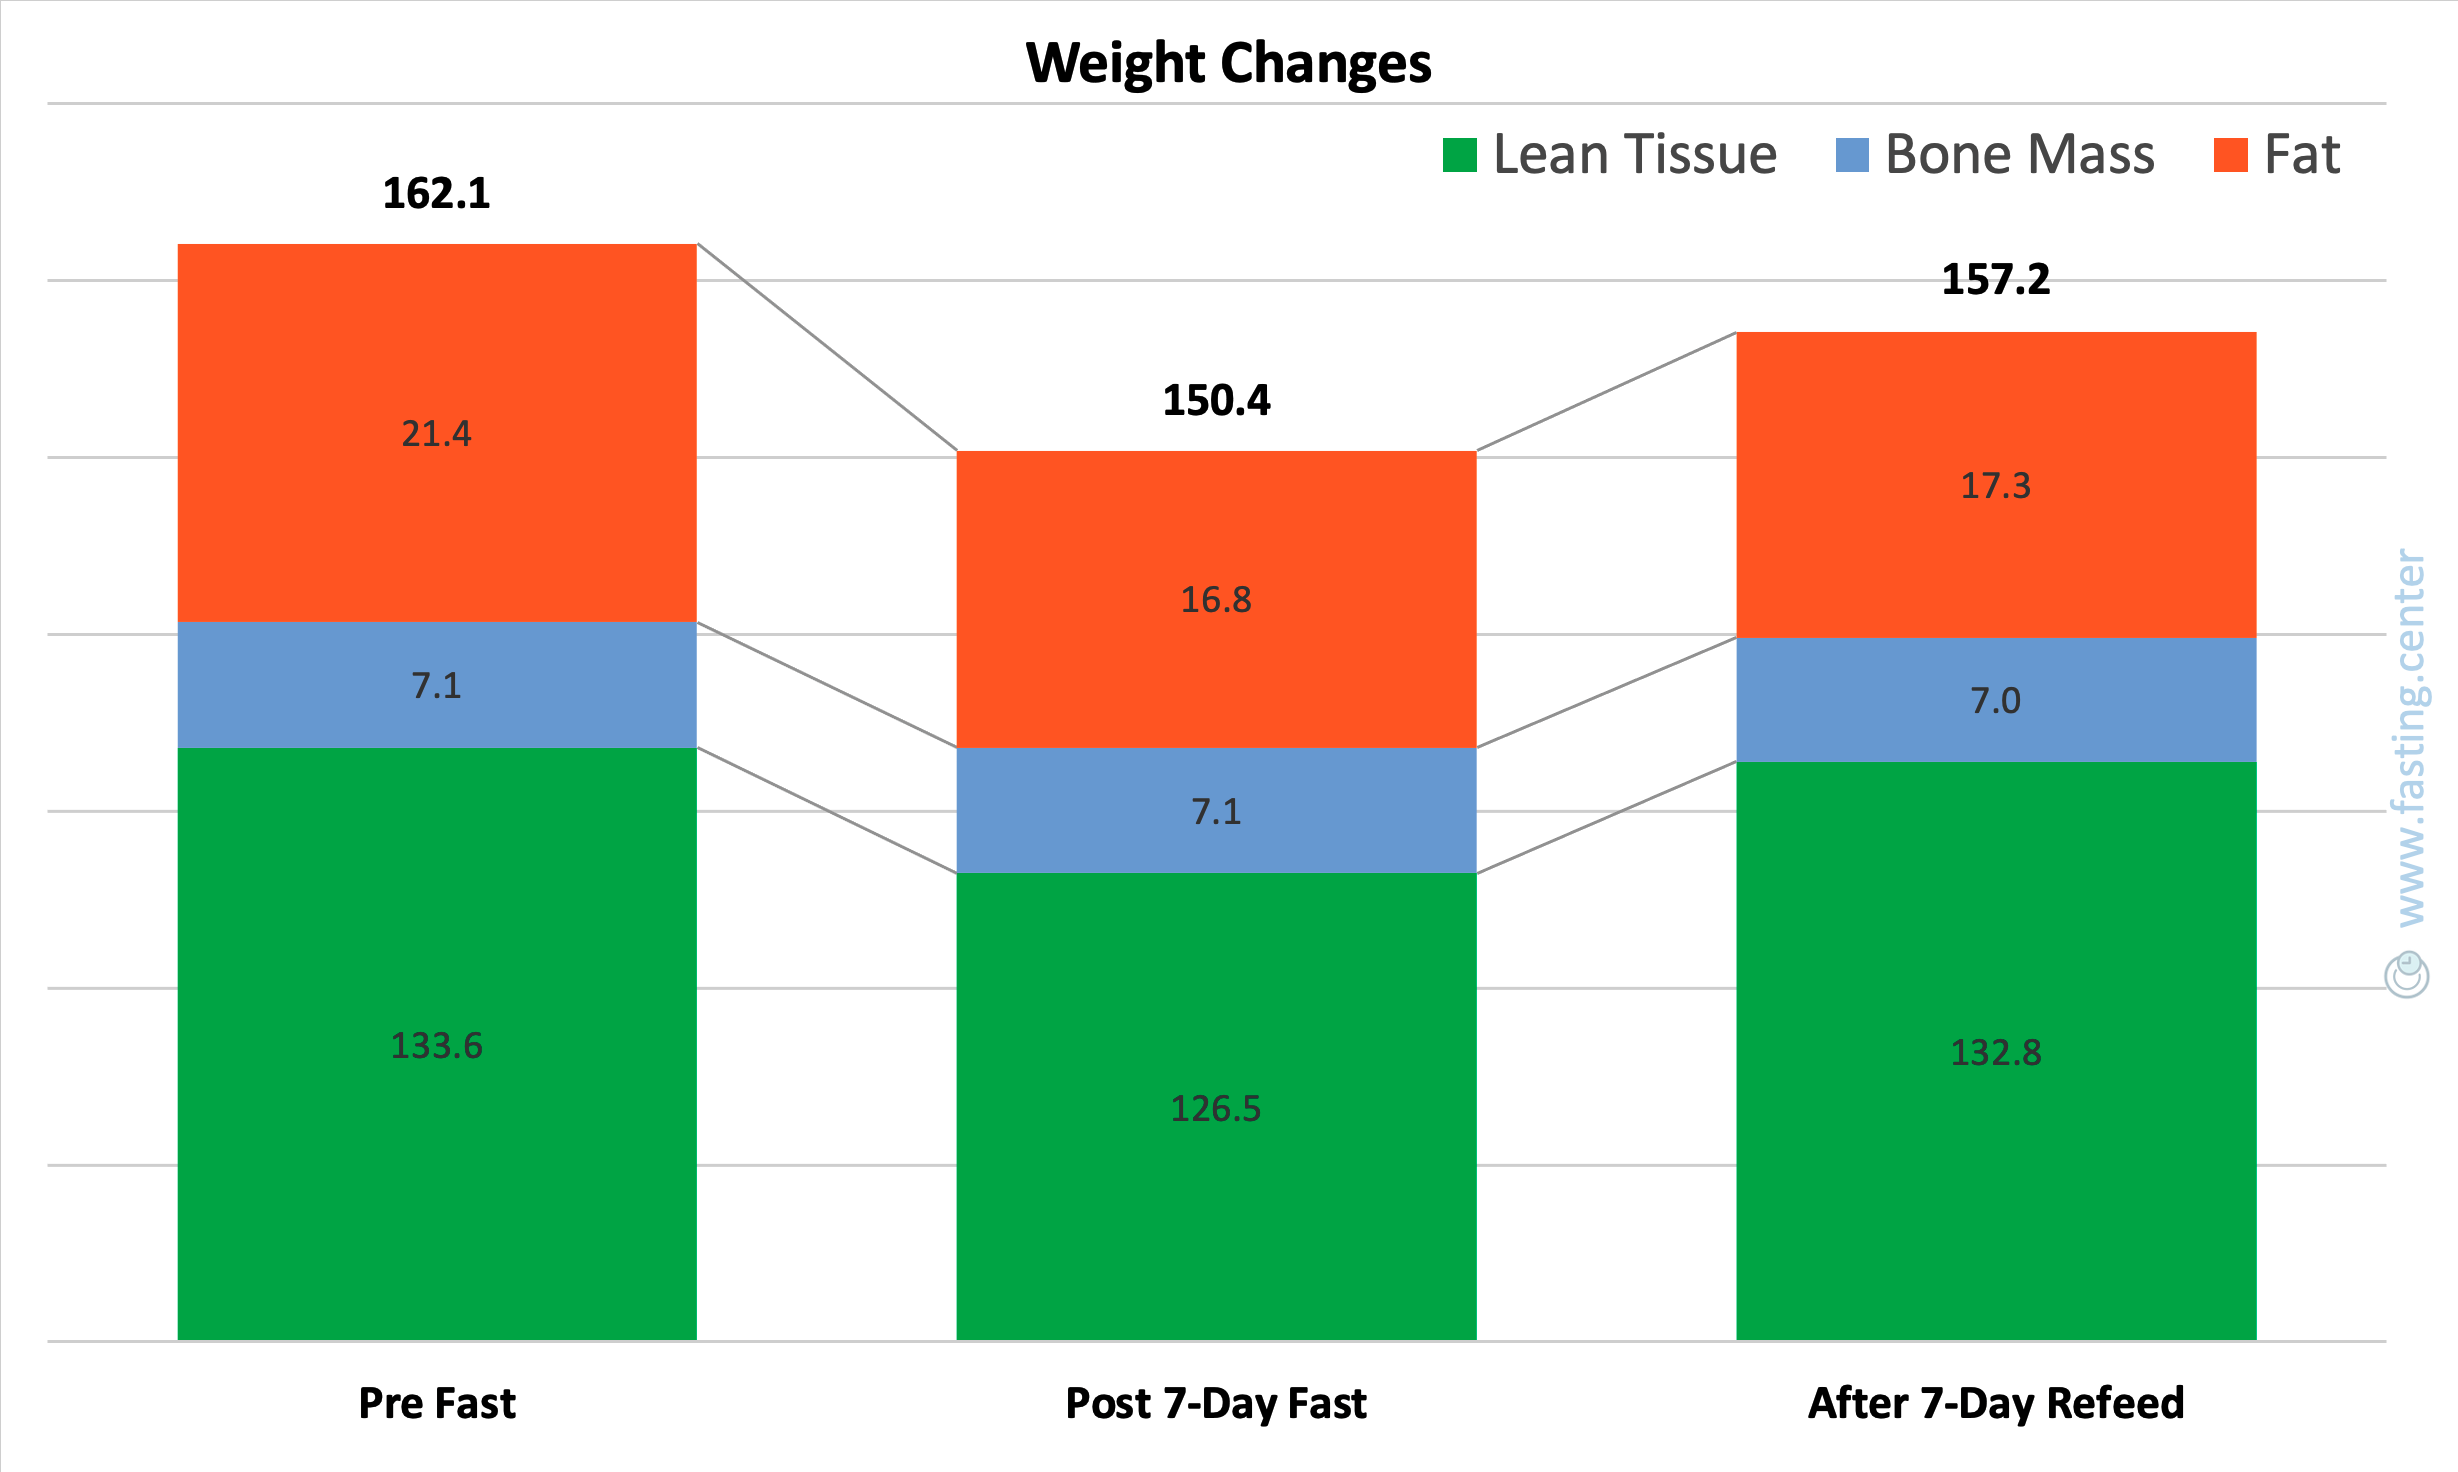
r/dataisbeautiful • u/andtitov • 22h ago
I tracked my body composition before a 7-day water fast, right after, and then after 7 days of refeeding.
One picture shows just how extreme - and fascinating - the changes were 😊
r/dataisbeautiful • u/Inboxmeyourcomics • 1d ago
When using the file visualization graph view, the files from this subset naturally form a two-arm galaxy. Data source shown in following images. Tools used: obsidian MD
r/dataisbeautiful • u/ppsreejith • 1d ago
A dataset of PERM applications from the US Dept of Labor & AI chat to allow you to explore the data
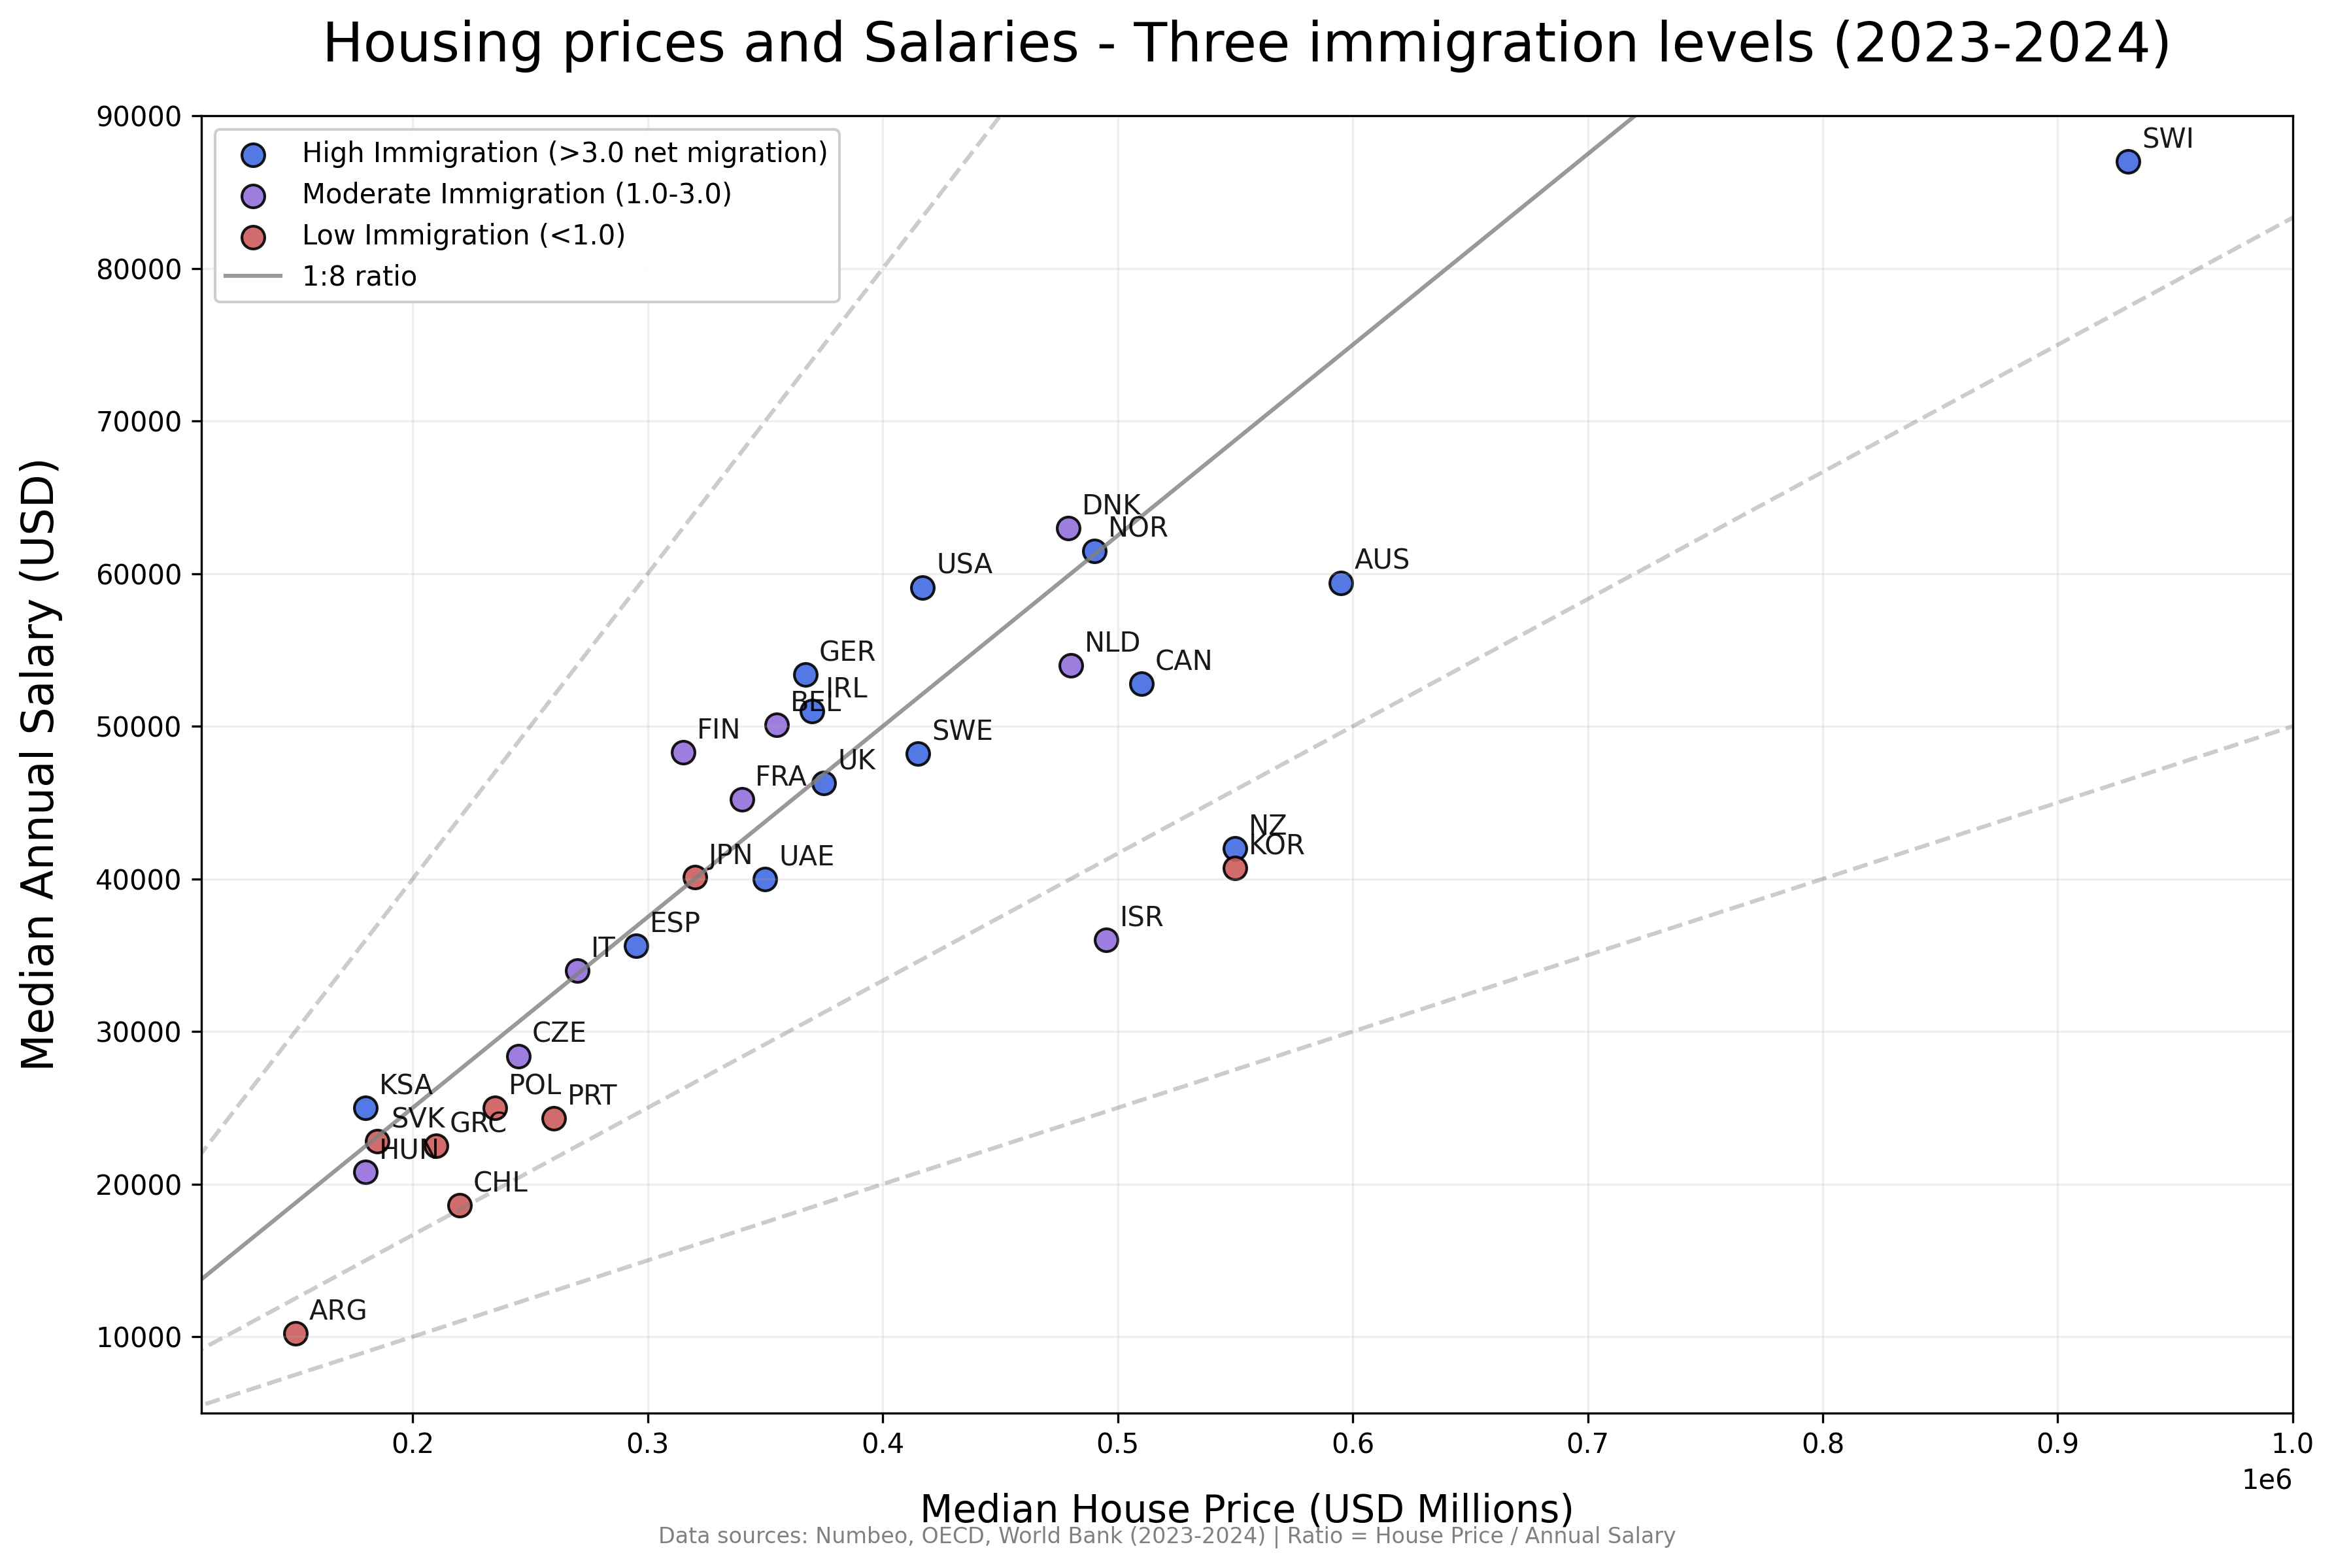
r/dataisbeautiful • u/Rauram99 • 2d ago
Notes:
I only included countries with >0.830 HDI >5 Millions population.
Net migration rates are a cumulative average for the last 5-10 years.
r/dataisbeautiful • u/rsrgrimm • 2d ago
To assess how draft position affected league performance, I looked into over 400 12-man leagues (all snake drafts) and plotted win ratio, normalized points earned (normalized within a given league to account for various scoring and roster settings), and final league ranking for each draft position.
Surprisingly, 1st pick performed worst on average across all metrics.
League data collected from Sleeper API.