r/dataisbeautiful • u/TA-MajestyPalm • 4d ago
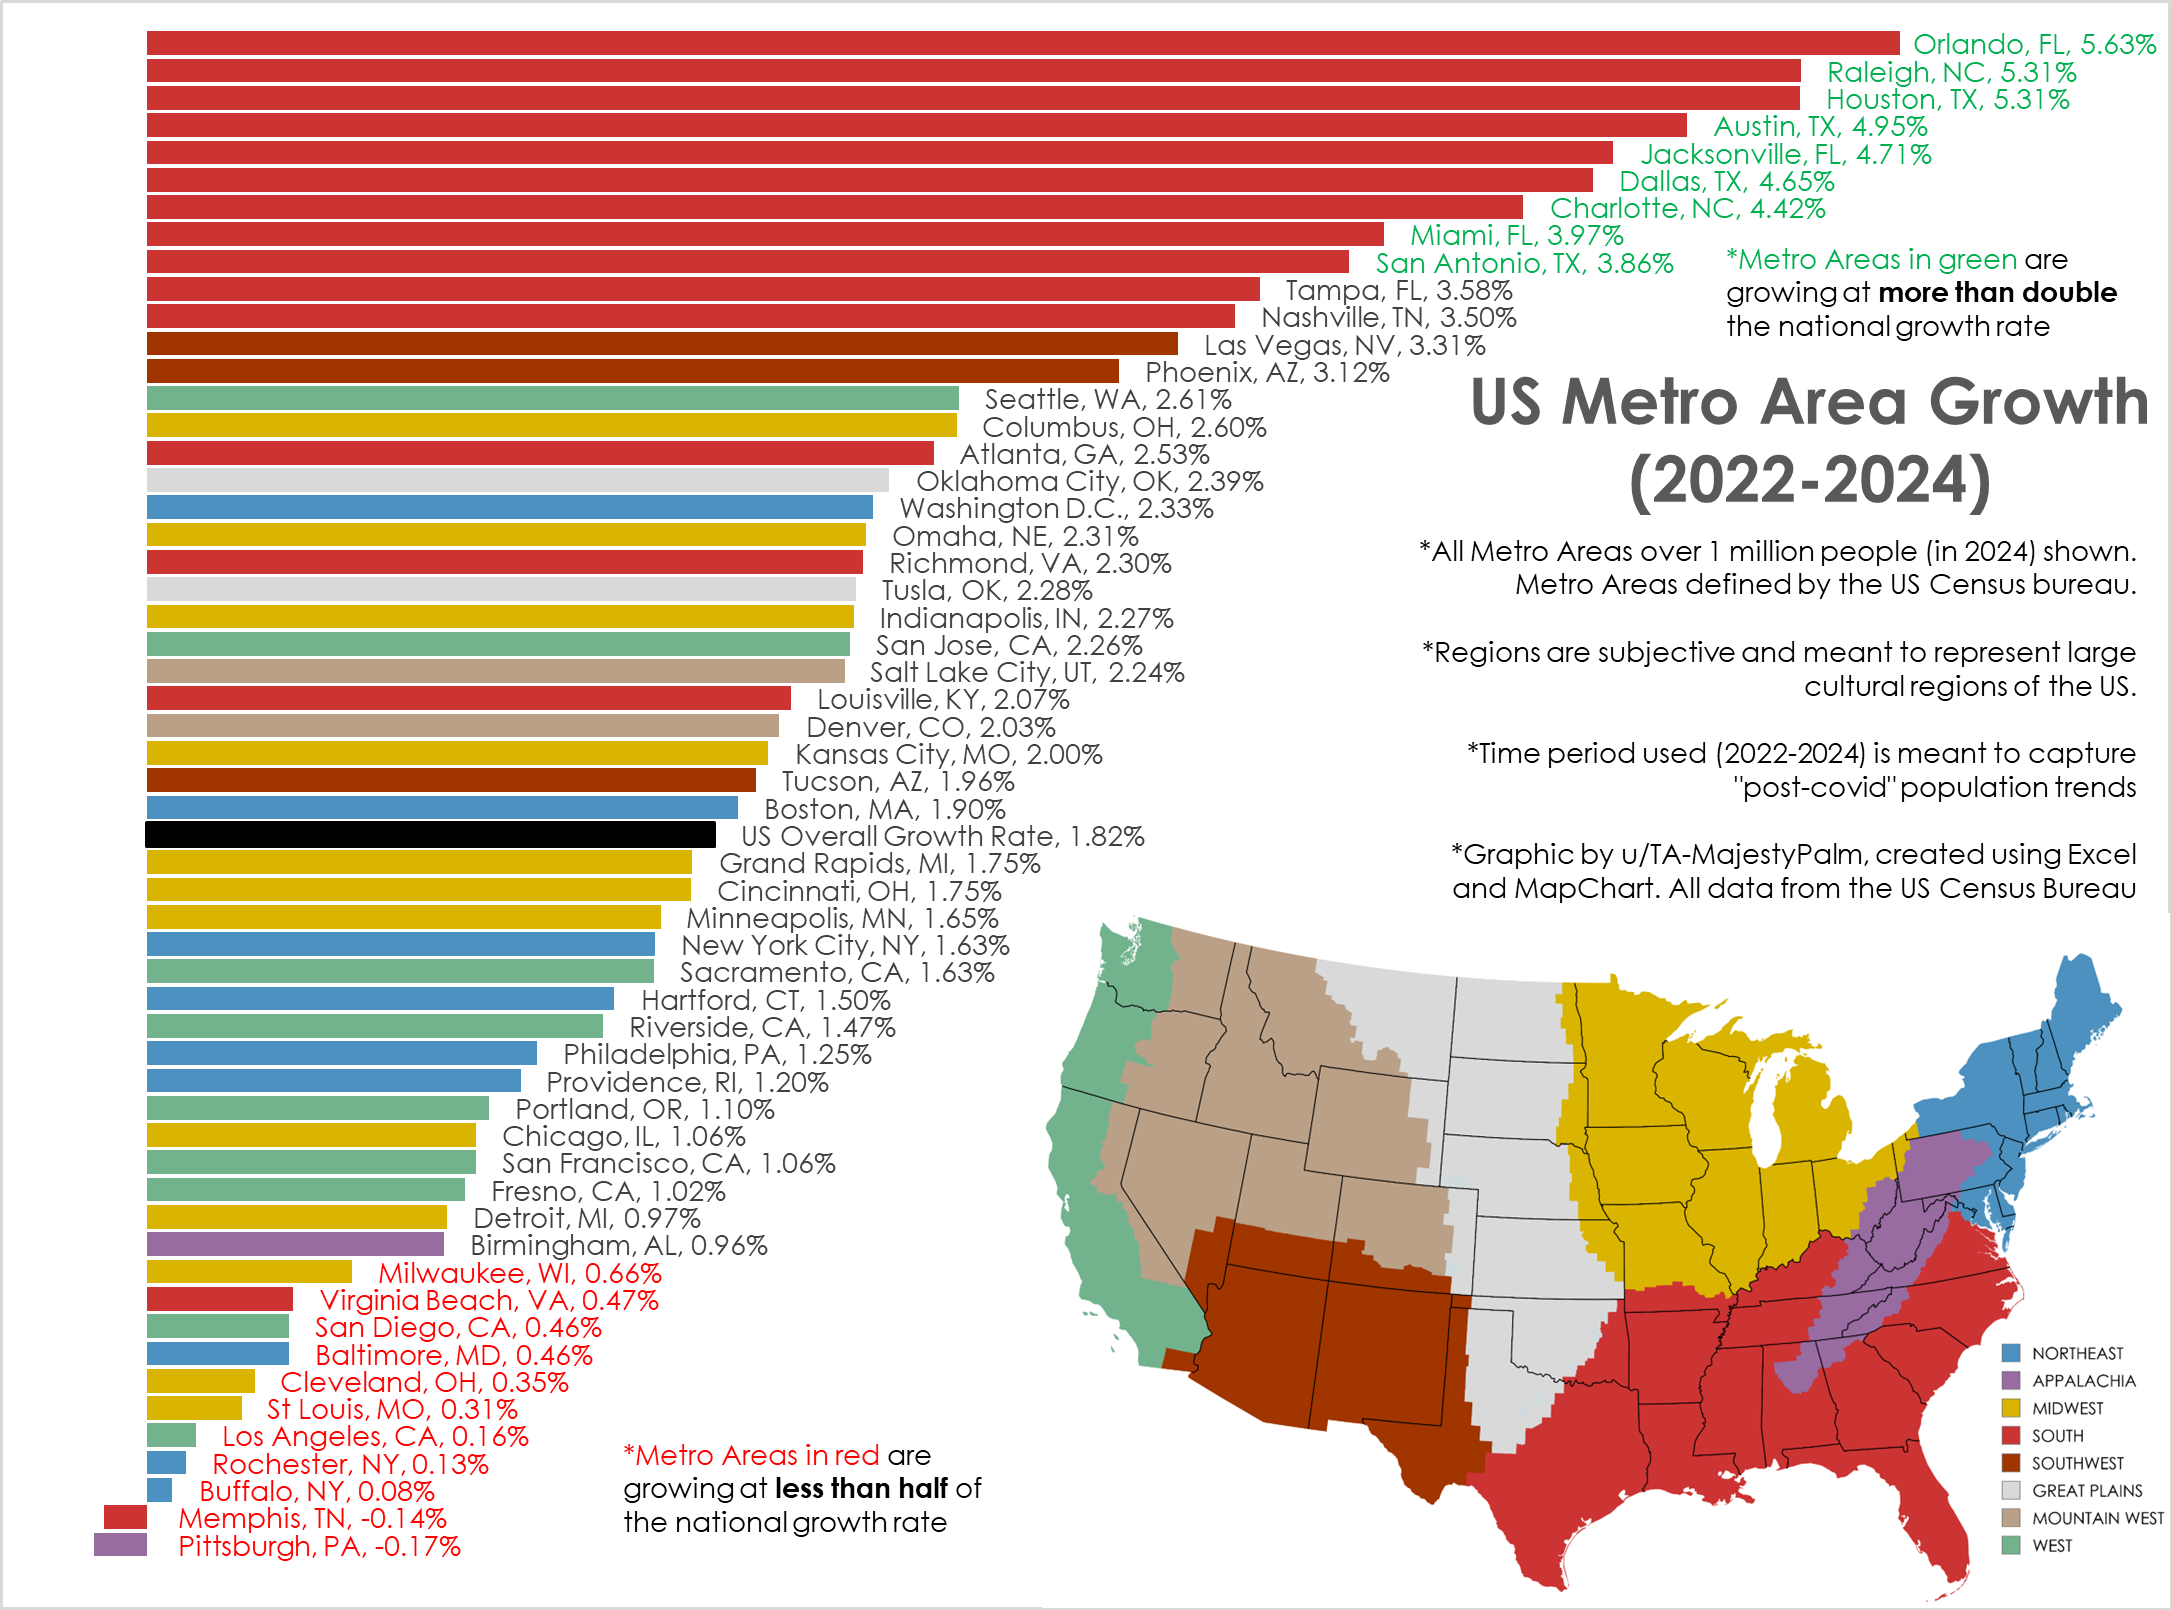
OC [OC] Post-Pandemic Population Growth Trends, by US Metro Area (2022->2024)
Graphic by me, created in Excel. All data from US Census here: https://www.census.gov/data/tables/time-series/demo/popest/2020s-total-metro-and-micro-statistical-areas.html
I've created similar graphics in the past, but usually from 2020-2024. This is not the best time frame as it combines the abnormal covid years with post pandemic movement.
This time frame (2022-2024) shows the most current and ongoing population trends of the last 2 years.
I also wanted to better categorize the cities into broad cultural regions vs the arbitrary geographic census regions.
876
Upvotes
62
u/TA-MajestyPalm 4d ago
Required comment:
Graphic by me, created in Excel.
All data from US Census here: https://www.census.gov/data/tables/time-series/demo/popest/2020s-total-metro-and-micro-statistical-areas.html
I've created similar graphics in the past, but usually from 2020-2024. This is not the best time frame as it combines the abnormal covid years with post-pandemic movement.
This time frame (2022-2024) shows the most current and ongoing population trends of the last 2 years.
I also wanted to better categorize the cities into broad cultural regions vs the arbitrary geographic census regions.