r/dataisbeautiful • u/TA-MajestyPalm • 4d ago
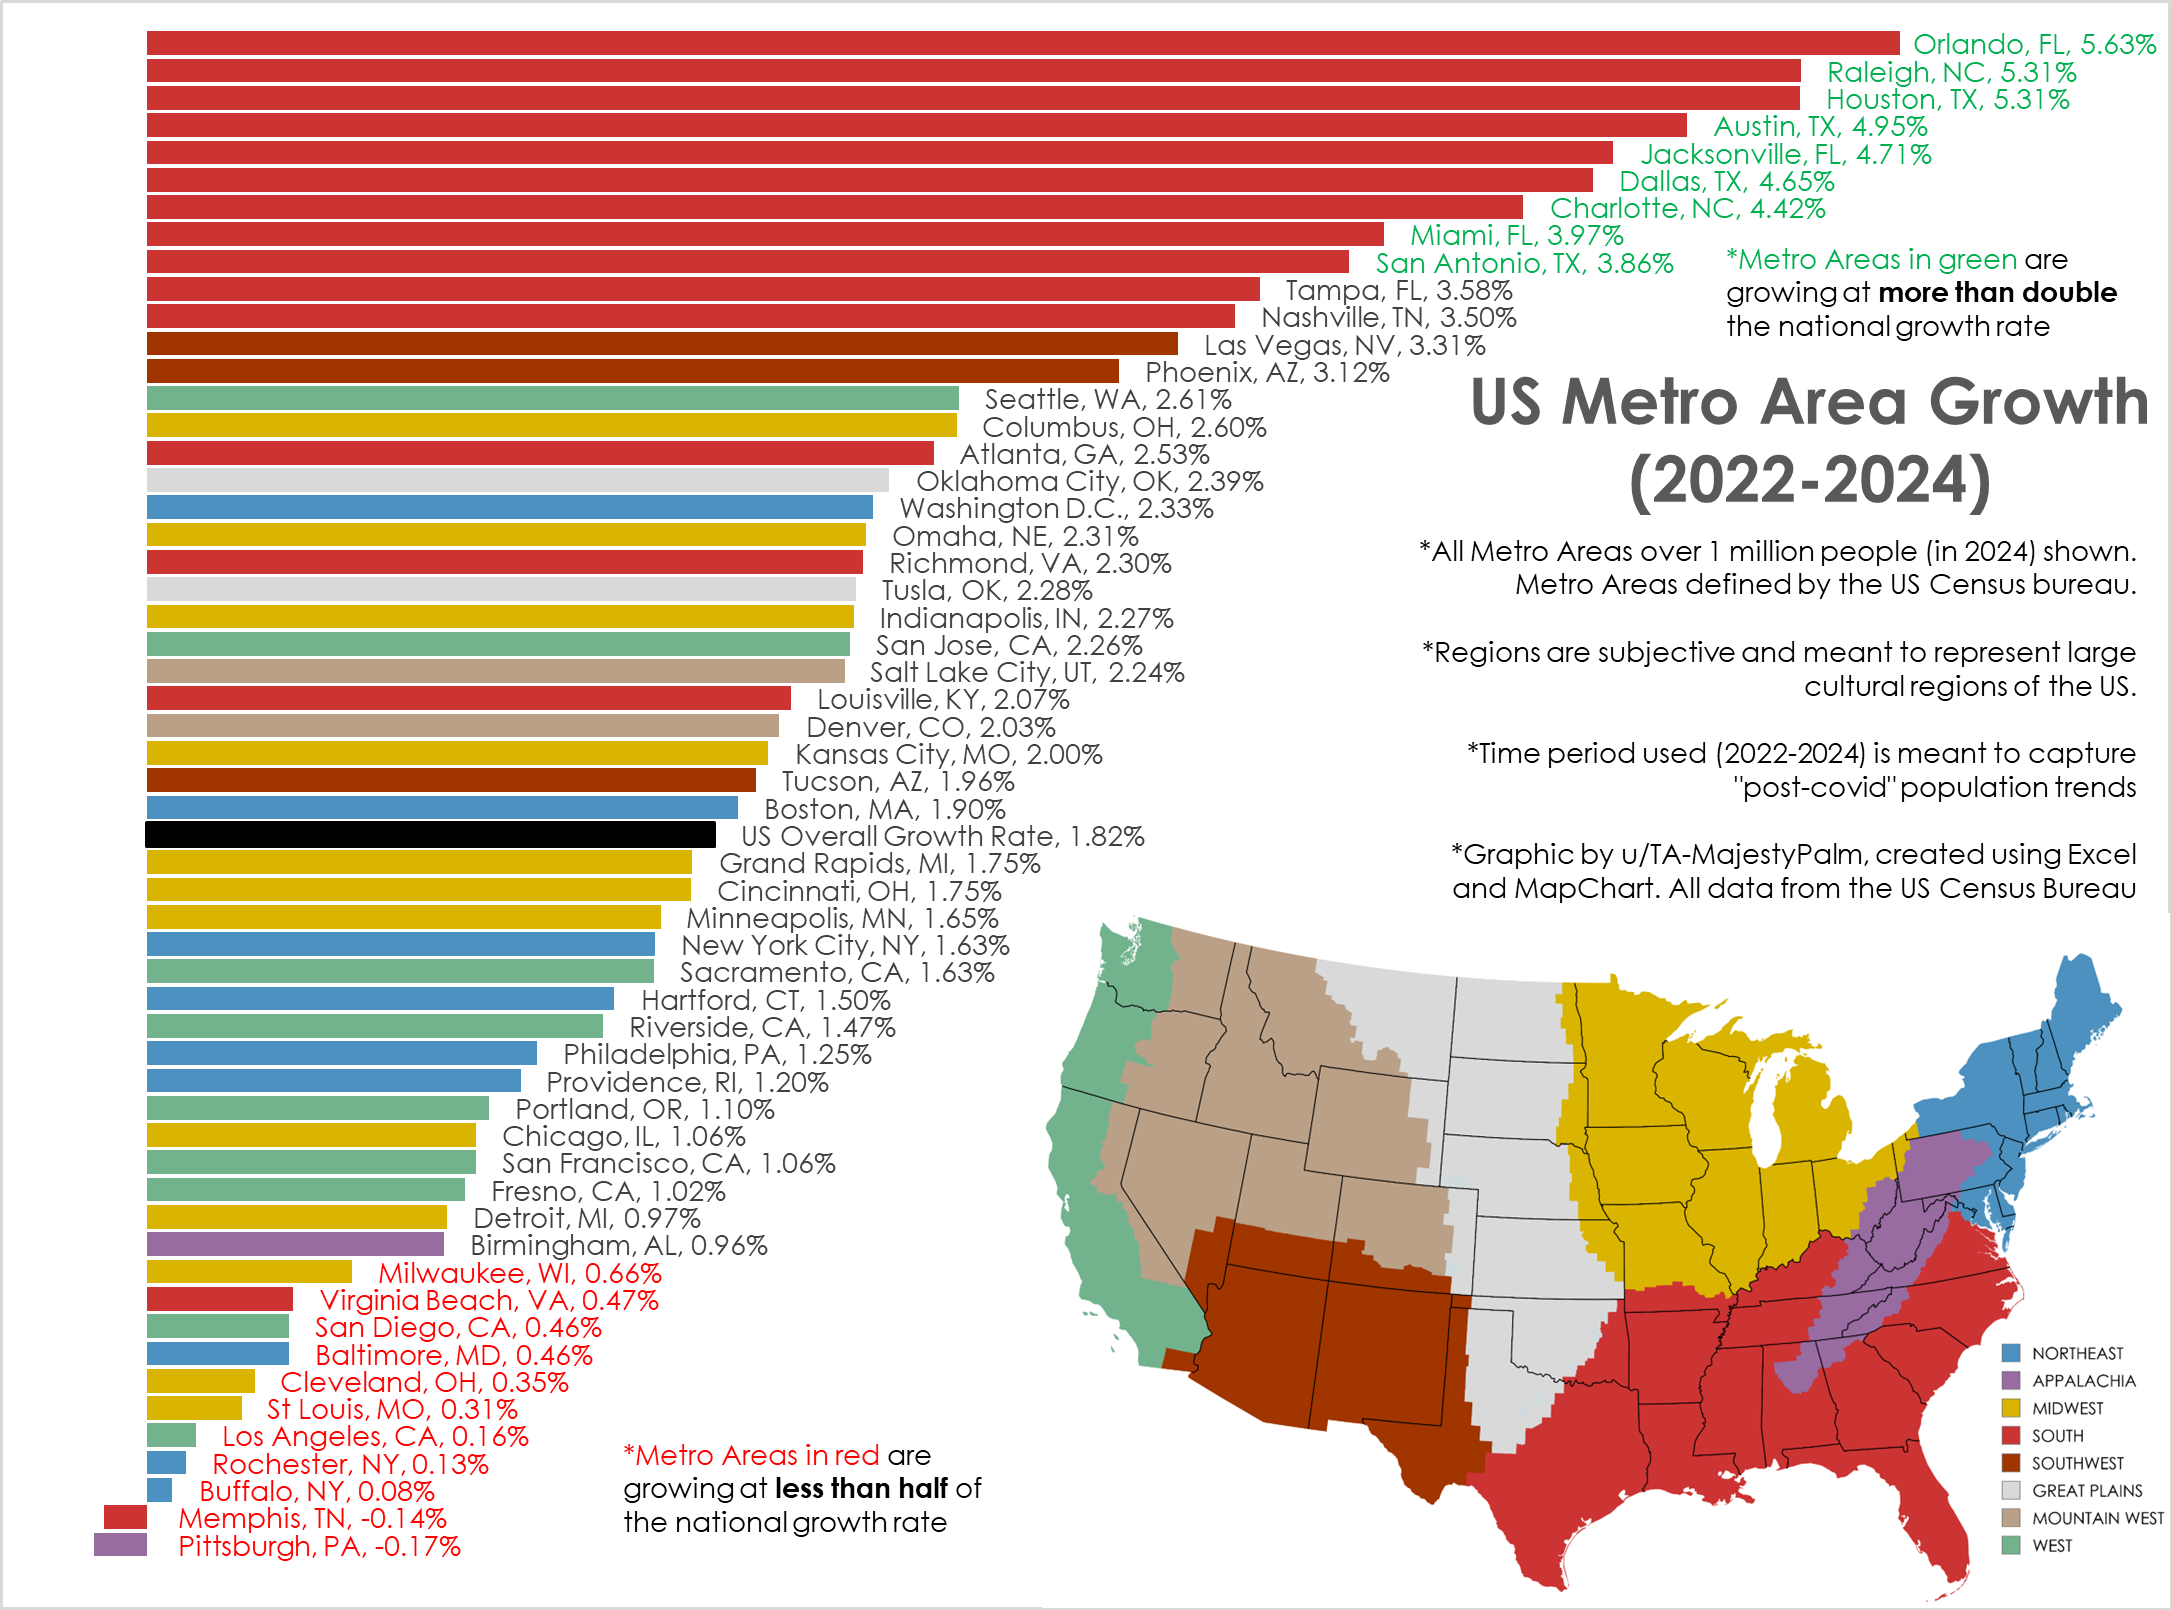
OC [OC] Post-Pandemic Population Growth Trends, by US Metro Area (2022->2024)
Graphic by me, created in Excel. All data from US Census here: https://www.census.gov/data/tables/time-series/demo/popest/2020s-total-metro-and-micro-statistical-areas.html
I've created similar graphics in the past, but usually from 2020-2024. This is not the best time frame as it combines the abnormal covid years with post pandemic movement.
This time frame (2022-2024) shows the most current and ongoing population trends of the last 2 years.
I also wanted to better categorize the cities into broad cultural regions vs the arbitrary geographic census regions.
884
Upvotes
2
u/Naytosan 3d ago
It'd be interesting to see this same chart along with median cost of living and income and property tax rates per state. Might be causation hunting, but it'd still be interesting to see, imo.