r/dataisbeautiful • u/TA-MajestyPalm • 4d ago
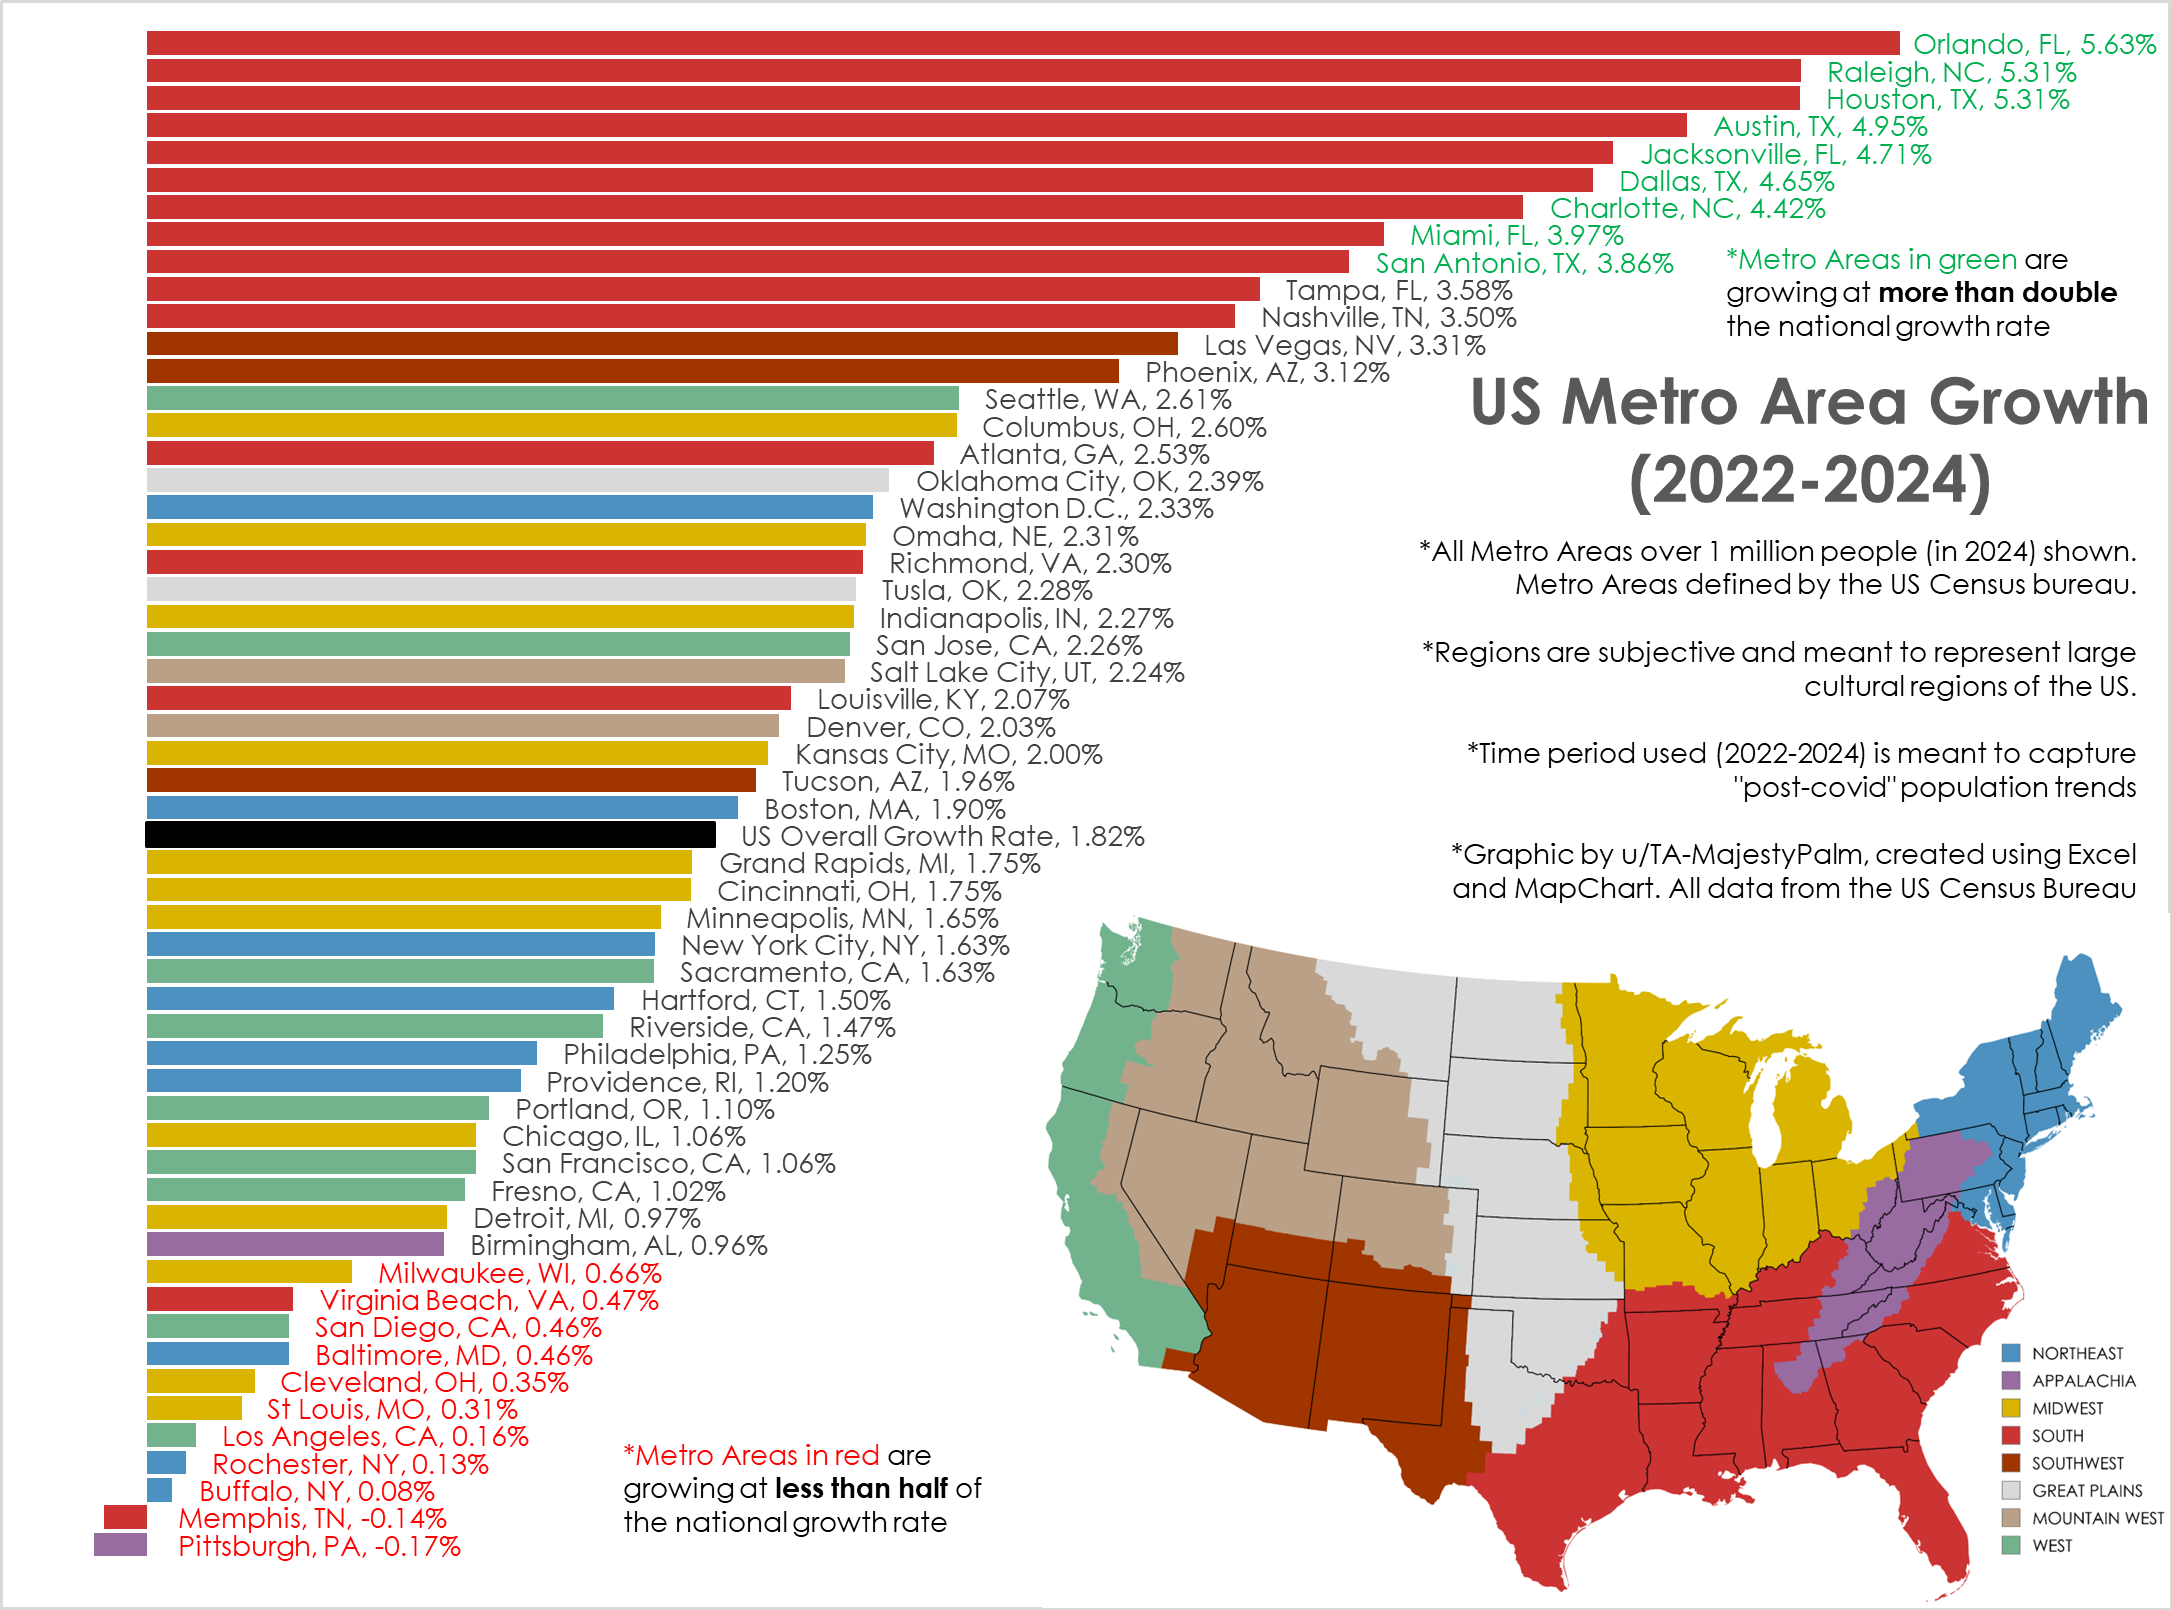
OC [OC] Post-Pandemic Population Growth Trends, by US Metro Area (2022->2024)
Graphic by me, created in Excel. All data from US Census here: https://www.census.gov/data/tables/time-series/demo/popest/2020s-total-metro-and-micro-statistical-areas.html
I've created similar graphics in the past, but usually from 2020-2024. This is not the best time frame as it combines the abnormal covid years with post pandemic movement.
This time frame (2022-2024) shows the most current and ongoing population trends of the last 2 years.
I also wanted to better categorize the cities into broad cultural regions vs the arbitrary geographic census regions.
878
Upvotes
14
u/miyamikenyati 3d ago
Interesting graphic, thanks for making it. Also a reminder that Reddit doesn’t equal real life.
And on cue the comments section fills up with people saying “because of climate change these numbers will reverse VERY SOON, and the Sun Belt will start losing population while the Rust Belt booms.”
I’ve been seeing this argument made for 7 or 8 years now (“VERY SOON”) and yet every year the numbers come out and the Sun Belt continues to grow while the Rust Belt continues to decline. It’s like the boy who cries wolf, “VERY SOON” never seems to actually happen.