r/dataisbeautiful • u/TA-MajestyPalm • 4d ago
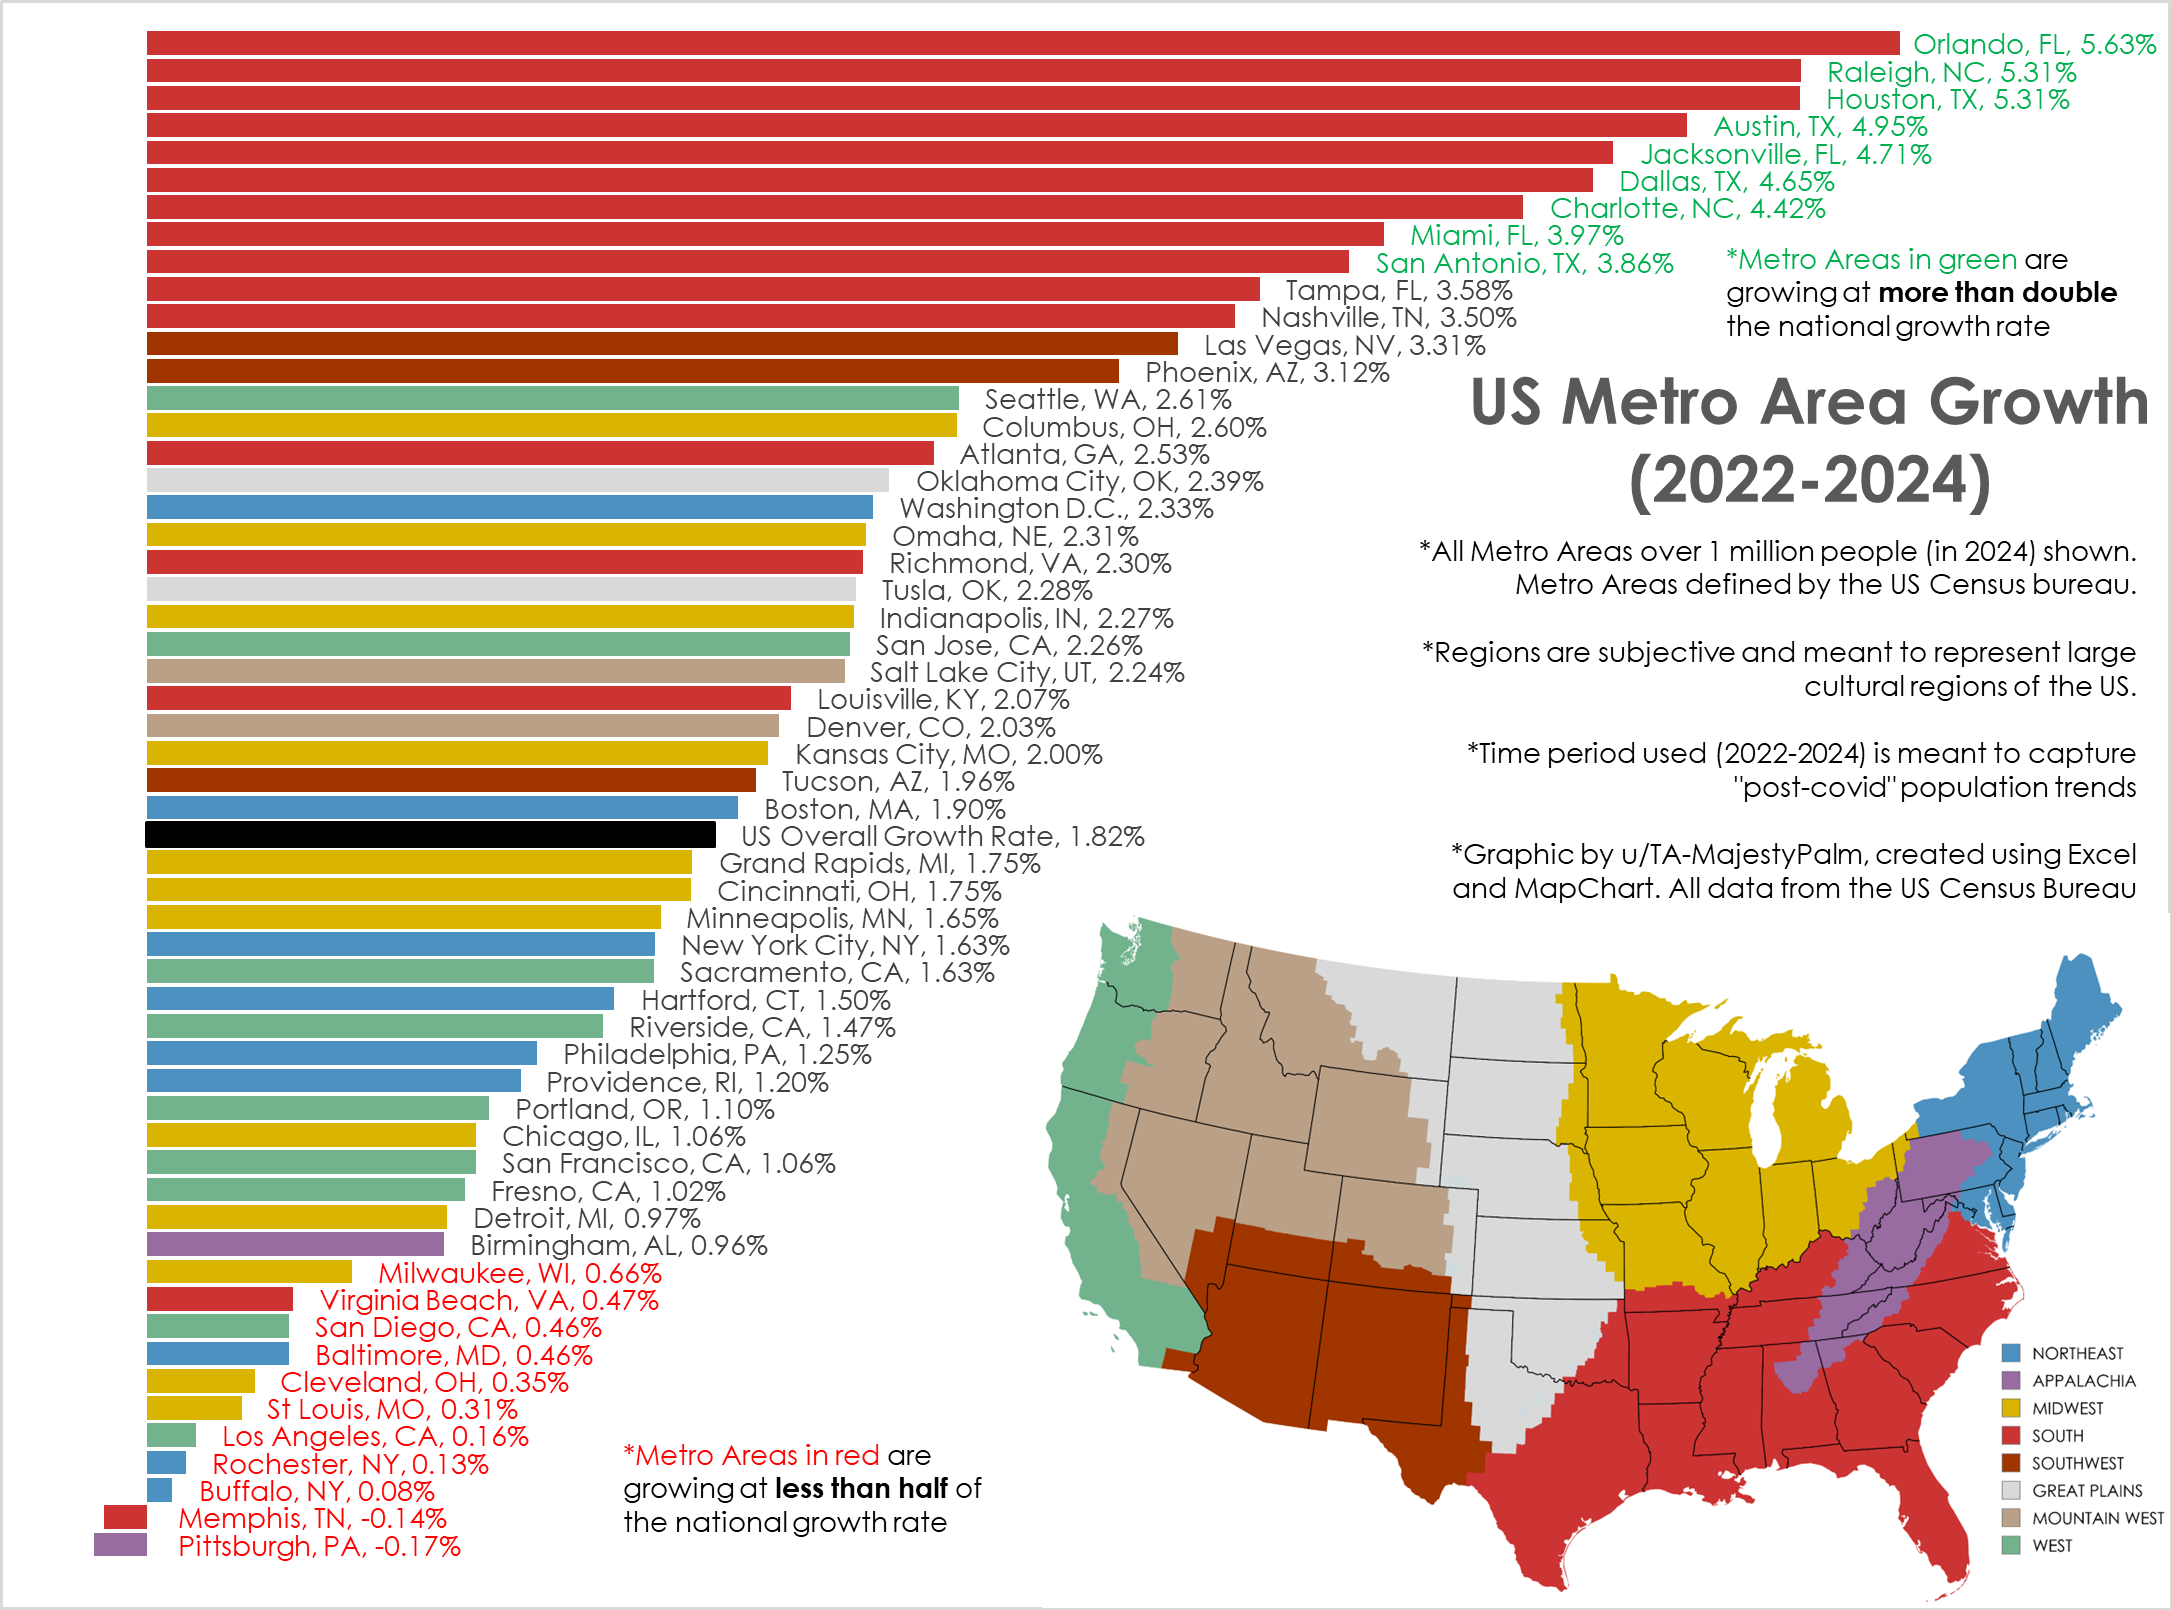
OC [OC] Post-Pandemic Population Growth Trends, by US Metro Area (2022->2024)
Graphic by me, created in Excel. All data from US Census here: https://www.census.gov/data/tables/time-series/demo/popest/2020s-total-metro-and-micro-statistical-areas.html
I've created similar graphics in the past, but usually from 2020-2024. This is not the best time frame as it combines the abnormal covid years with post pandemic movement.
This time frame (2022-2024) shows the most current and ongoing population trends of the last 2 years.
I also wanted to better categorize the cities into broad cultural regions vs the arbitrary geographic census regions.
878
Upvotes
1
u/ds629 3d ago
Yep yep. Once again, if you take the most upvoted popular hivemind opinion on reddit and then inverse it, you'd be closer to reality and the truth.
"People are leaving Florida in droves" - wrong
"Texas is such a hellhole and they are losing so many people" - wrong
Doesn't even matter if you present them with the Census data (on the topic of population), they'll perform mental gymnastics instead of admitting they're wrong. I live in one of those northern metros, so it's not like I'm even personally invested in this topic.