r/dataisbeautiful • u/TA-MajestyPalm • 4d ago
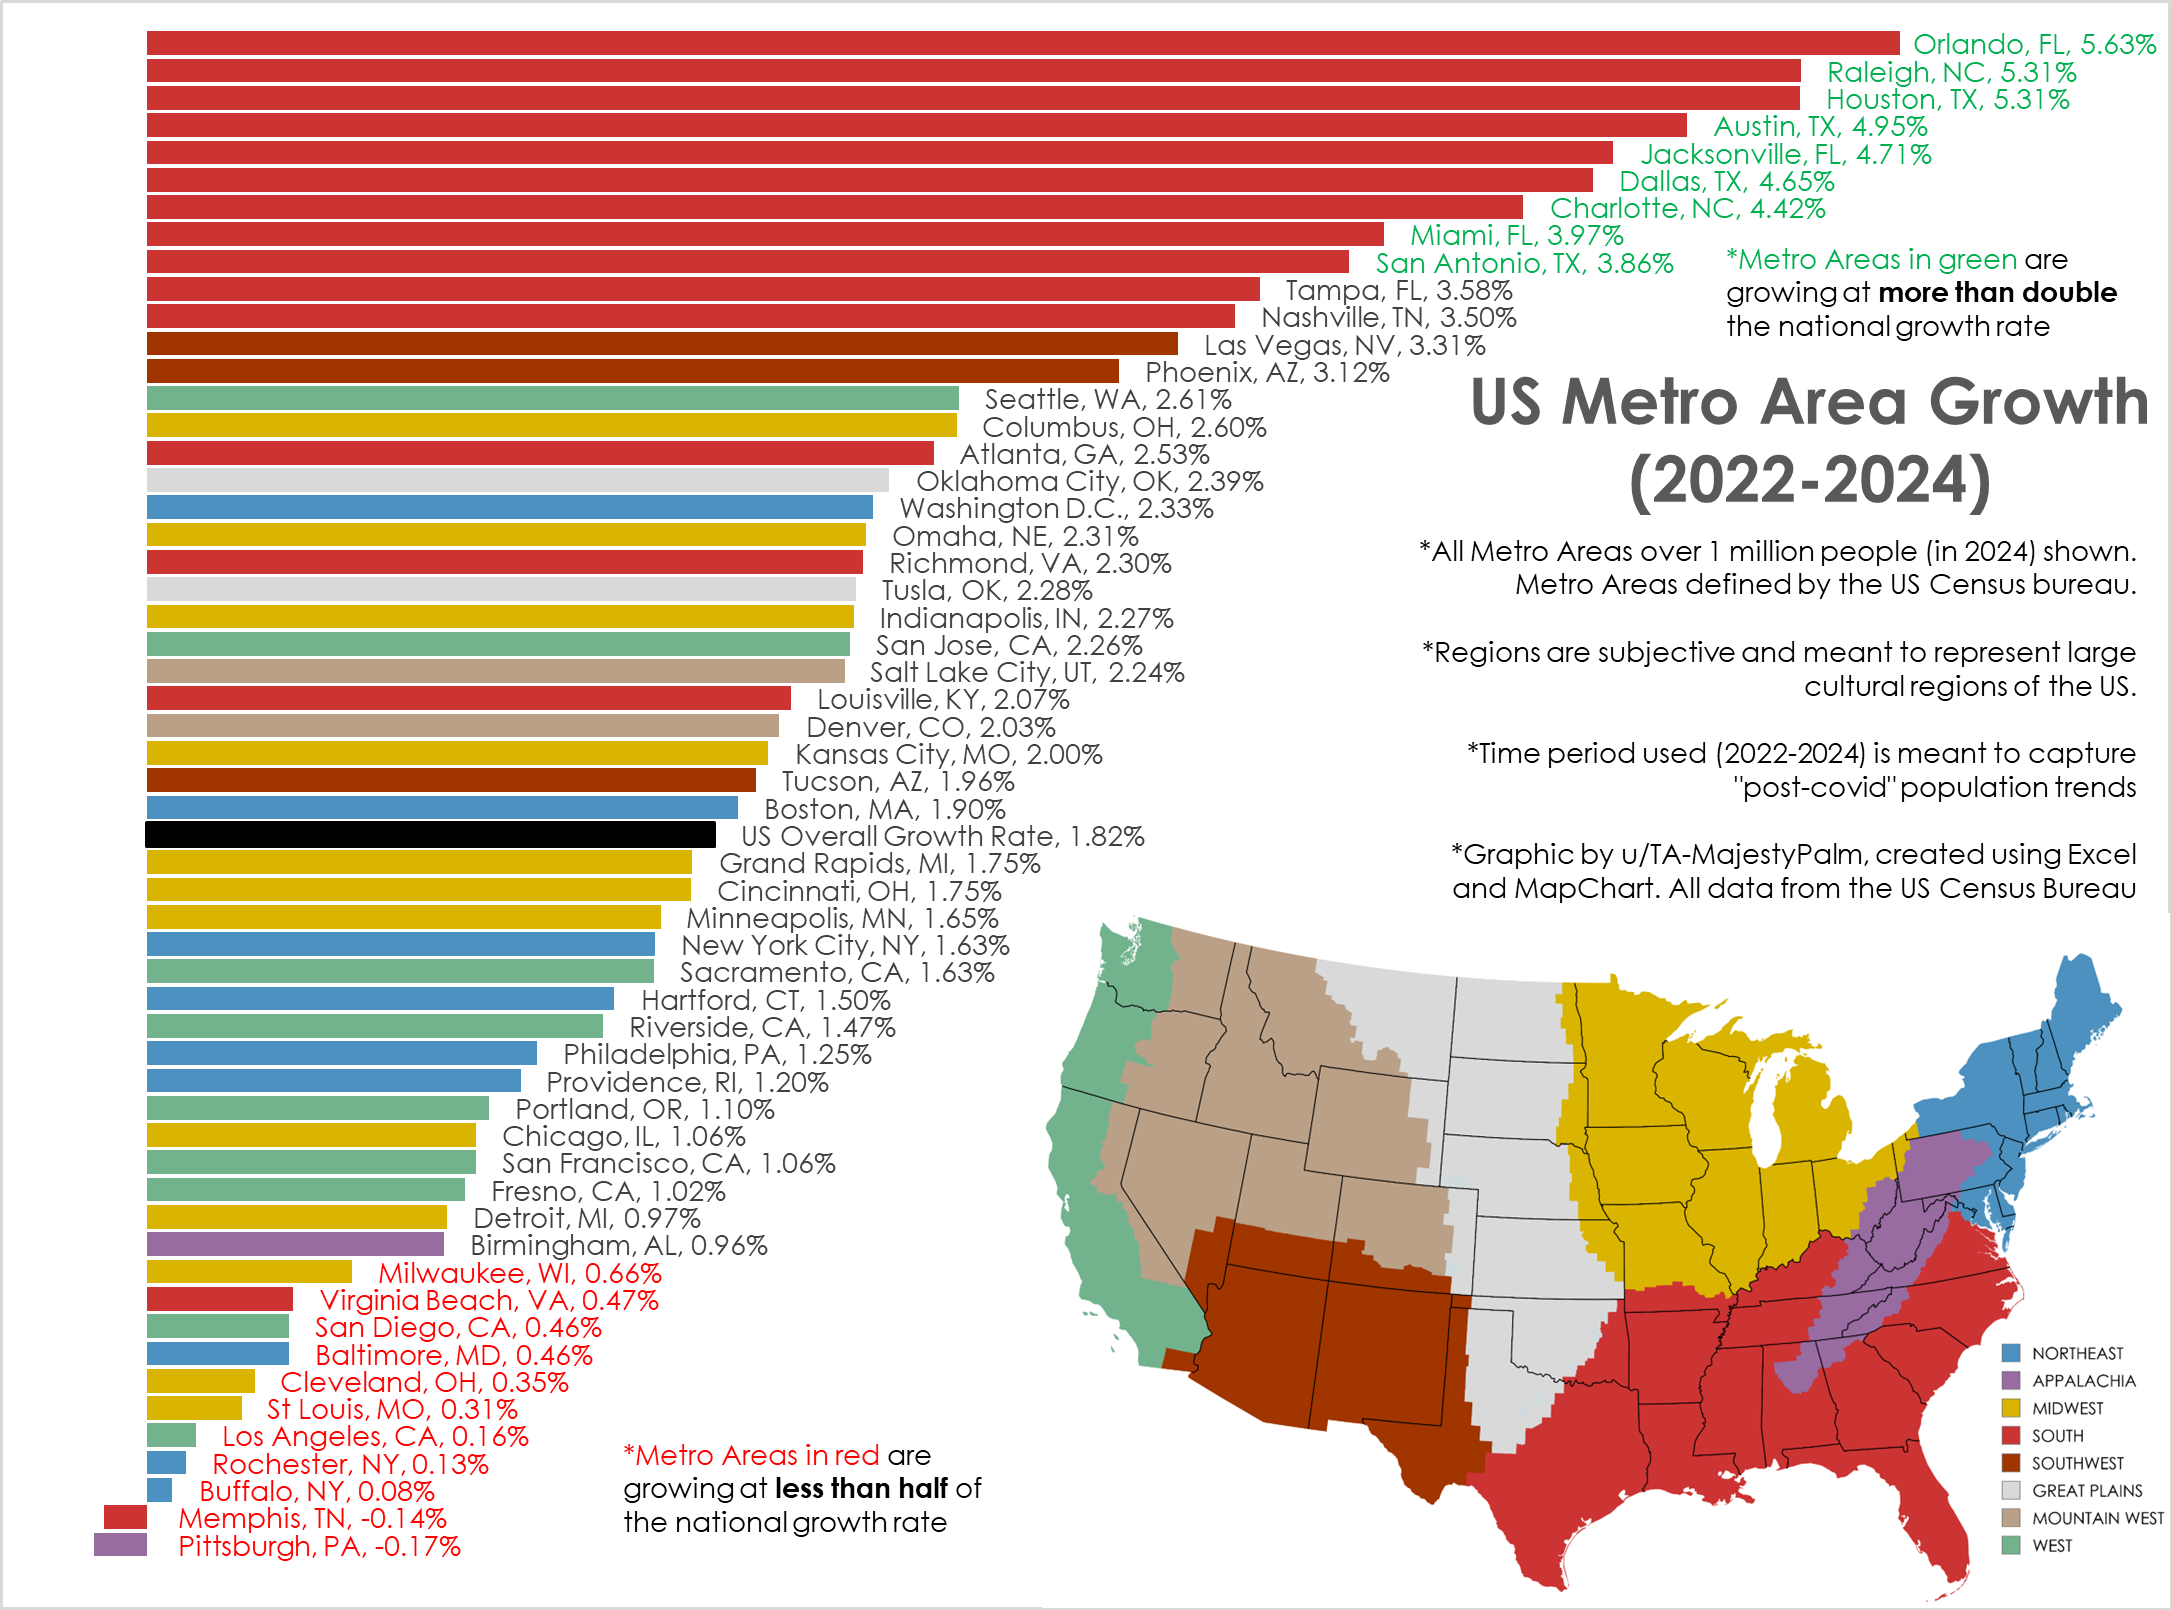
OC [OC] Post-Pandemic Population Growth Trends, by US Metro Area (2022->2024)
Graphic by me, created in Excel. All data from US Census here: https://www.census.gov/data/tables/time-series/demo/popest/2020s-total-metro-and-micro-statistical-areas.html
I've created similar graphics in the past, but usually from 2020-2024. This is not the best time frame as it combines the abnormal covid years with post pandemic movement.
This time frame (2022-2024) shows the most current and ongoing population trends of the last 2 years.
I also wanted to better categorize the cities into broad cultural regions vs the arbitrary geographic census regions.
879
Upvotes
68
u/scoofy 3d ago edited 3d ago
Fun fact. Highways have a finite capacity. Once they hit that capacity, the become exponentially worse with each additional automobile on the road, and they're effectively impossible to increase in capacity over time. It's like filling a bathtub faster than it can drain: once the water starts spilling over the side there's basically nothing you can do to stop it, and all the extra water is a problem.
We built all these highways one or two generations ago, and they were smart enough to build them all with tons of excess capacity built in -- enough to last a lifetime. Welp, now it's been a lifetime, and they're failing. Cars are much more efficient in the short run, when there's lots of greenfield construction going on, but once you hit the highway capacity in your city at peak times, it's much for efficient to switch to a high density, variable scale, from of public transit (trains, trams, BRT, etc.) simply because they will always have excess capacity to fill.