r/dataisbeautiful • u/TA-MajestyPalm • 4d ago
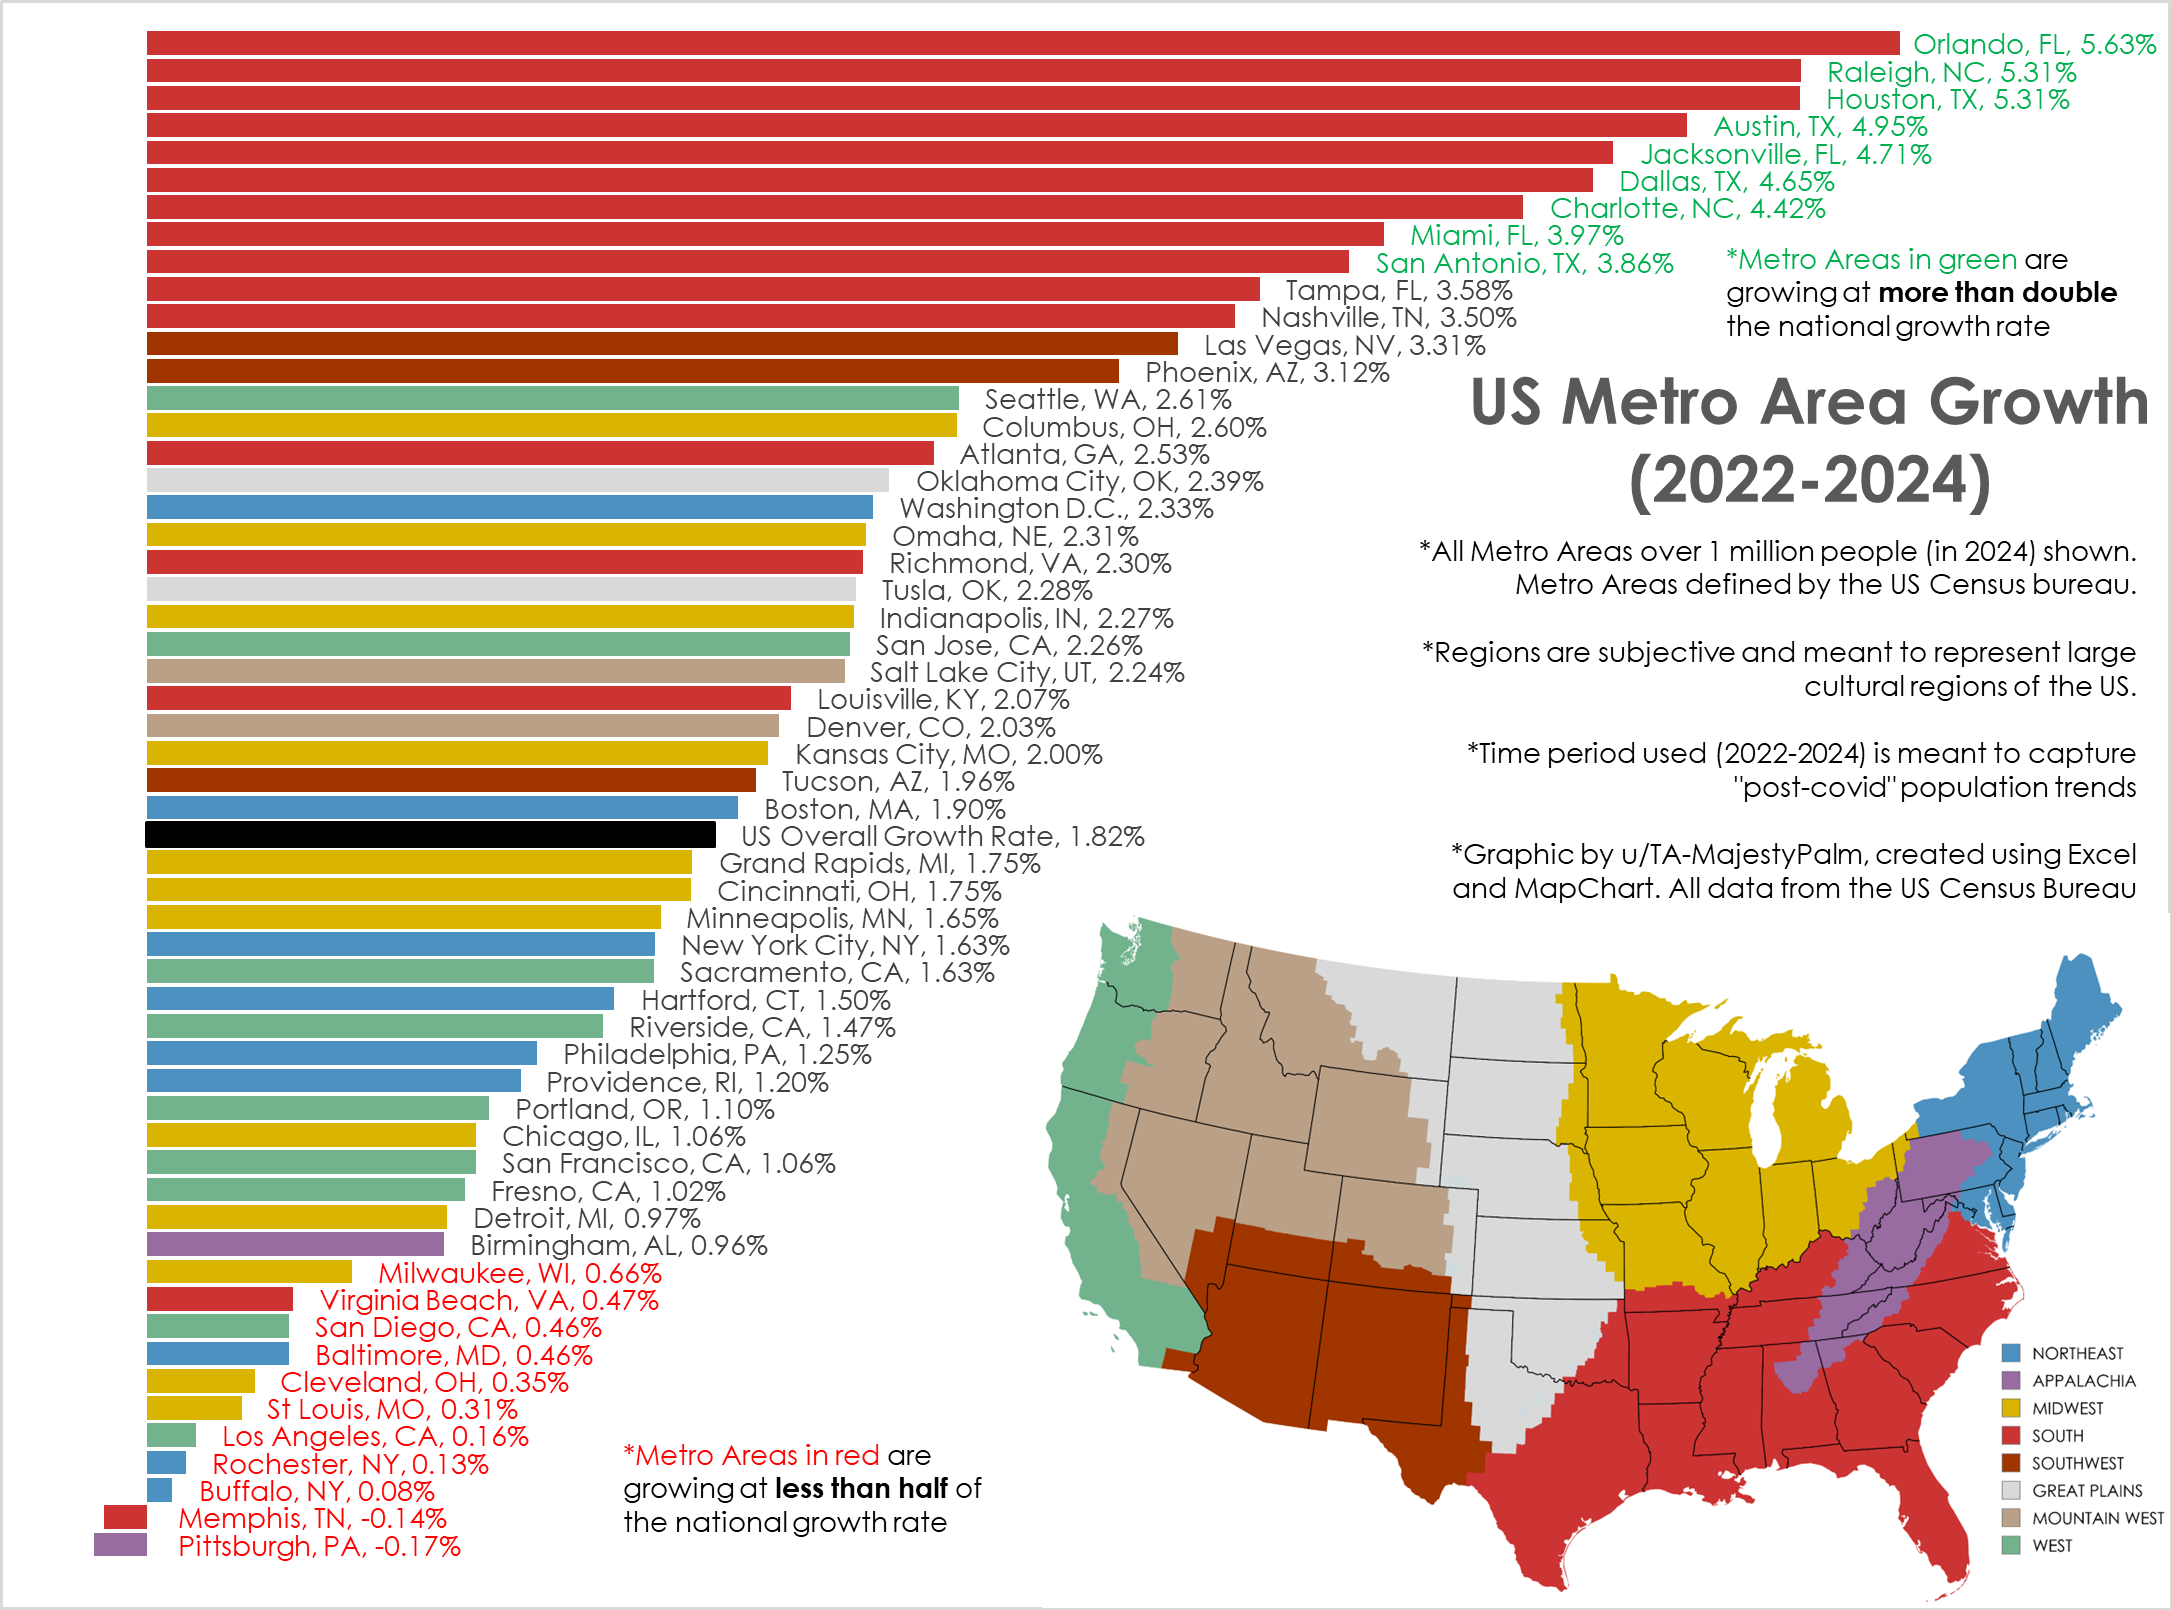
OC [OC] Post-Pandemic Population Growth Trends, by US Metro Area (2022->2024)
Graphic by me, created in Excel. All data from US Census here: https://www.census.gov/data/tables/time-series/demo/popest/2020s-total-metro-and-micro-statistical-areas.html
I've created similar graphics in the past, but usually from 2020-2024. This is not the best time frame as it combines the abnormal covid years with post pandemic movement.
This time frame (2022-2024) shows the most current and ongoing population trends of the last 2 years.
I also wanted to better categorize the cities into broad cultural regions vs the arbitrary geographic census regions.
884
Upvotes
10
u/OurNewestMember 3d ago
Can you talk to them about putting a few concrete case studies on the website (brief but compelling ones), and brief descriptions of real policies they are tracking? (Eg, "Appleville, USA Town board just used the slide deck below to pressure state authorities into a more fair highway expansion maintenance funding plan near the town watershed")
Currently the website comes across really vague and bloated which makes it seem like an untrustworthy front (seeming friendly enough, but in a "what is their real agenda?" Kind of way)
This page was more palatable:
https://www.strongtowns.org/about#about3
Not sure if you're actually associated with this or not but your language mirrored the site's ("the development pattern is to blame") so maybe you care about the site's communication, too.
Anyway, interesting idea. Would be good to see what it actually achieves in practice to see if it's a good idea