You're wrong. Log graphs handle growth rates much better. Here you cannot even tell the order of magnitude difference at the beginning of the timeline.
What do you mean by intuitive? They do an excellent job showing the magnitude of difference between two data sets. It's very intuitive for the story it tells.
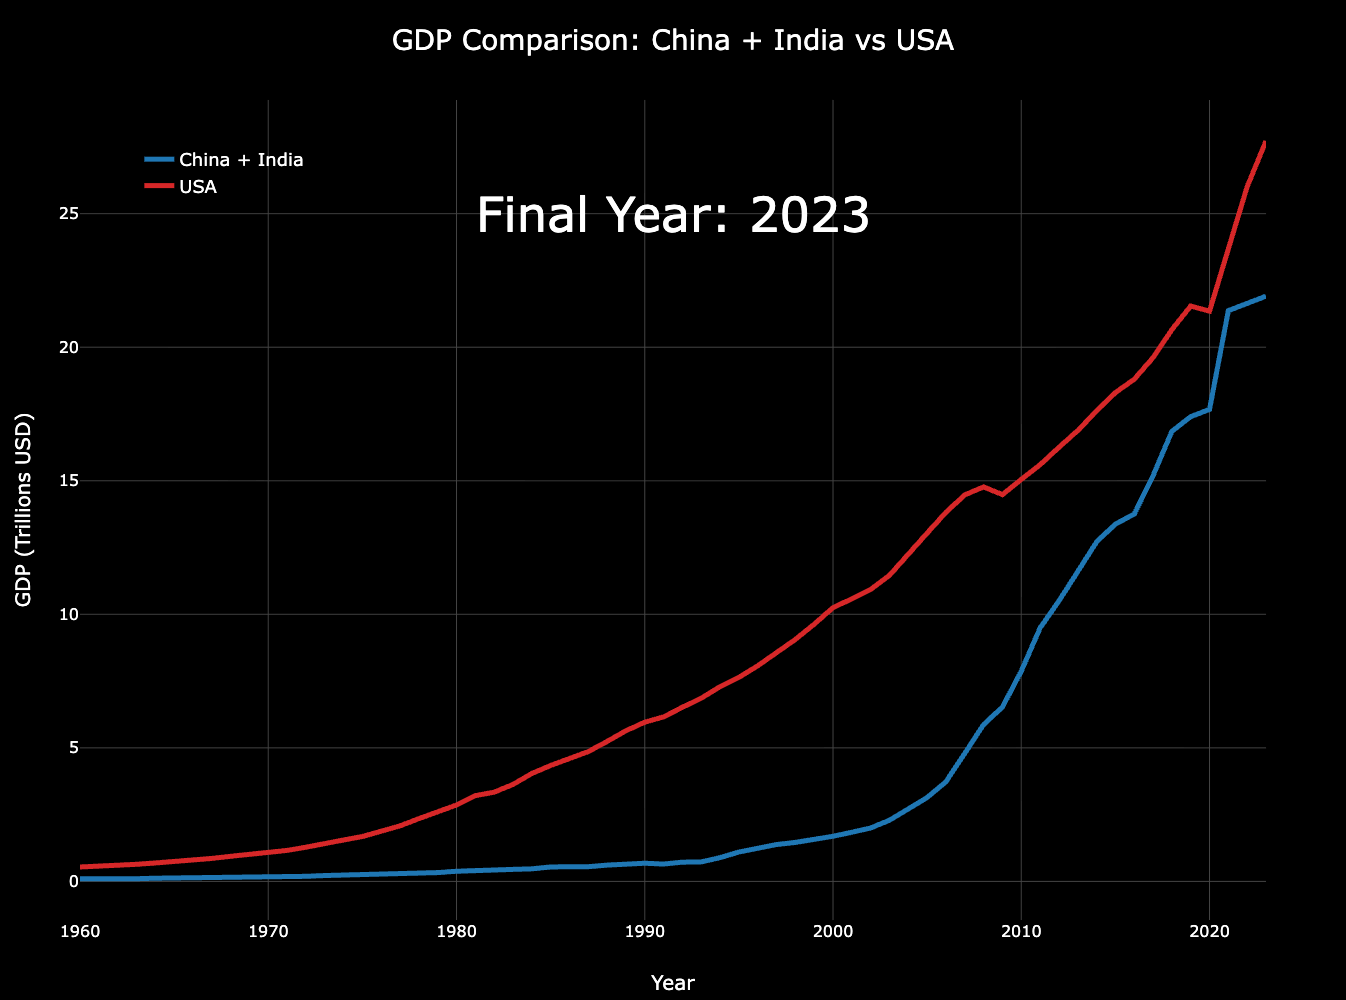
What do you mean? If you want to show the magnitude of differences rather than absolute differences then log is more intuitive for that. Otherwise you have to look here and think "hmm, in 1990 USA is at 5 while India + China is at .3 , so that's 20x or about a magnitude and a half different.
9
u/moderngamer327 3d ago
Log graphs are always garbage because they are incredibly unintuitive. It’s much easier to gain information at a glance from the original