r/dataisbeautiful • u/oscarleo0 • 1d ago
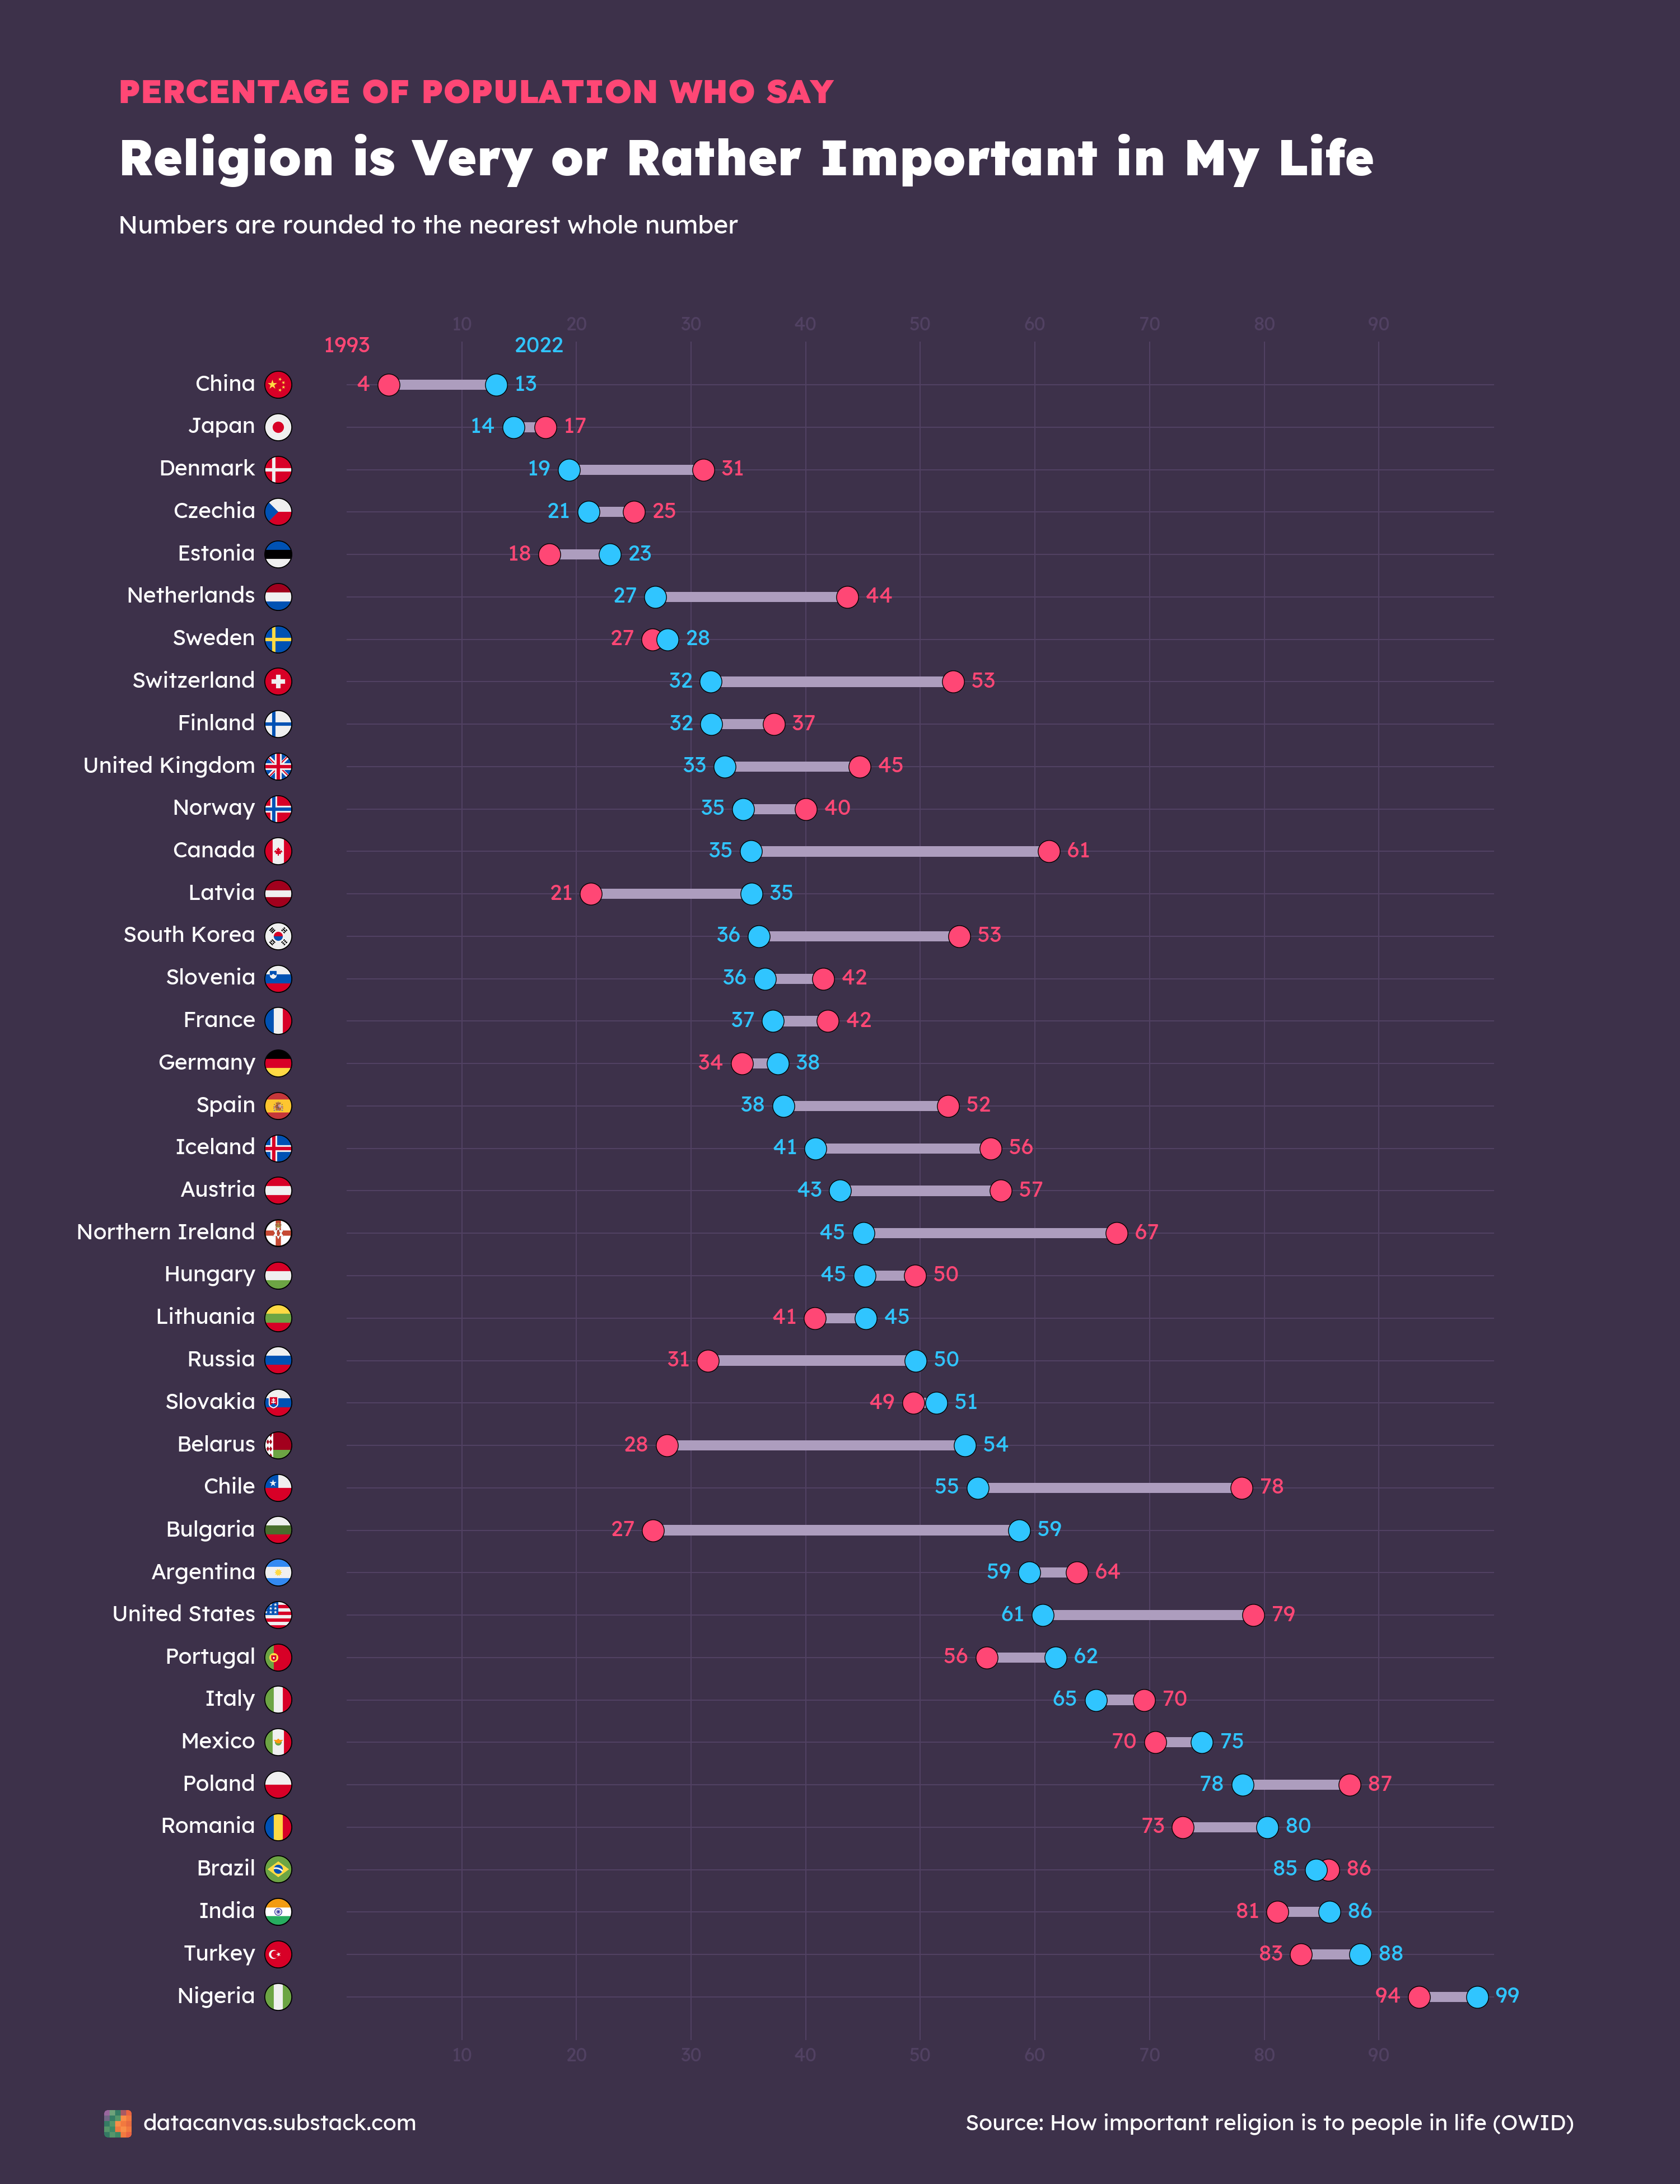
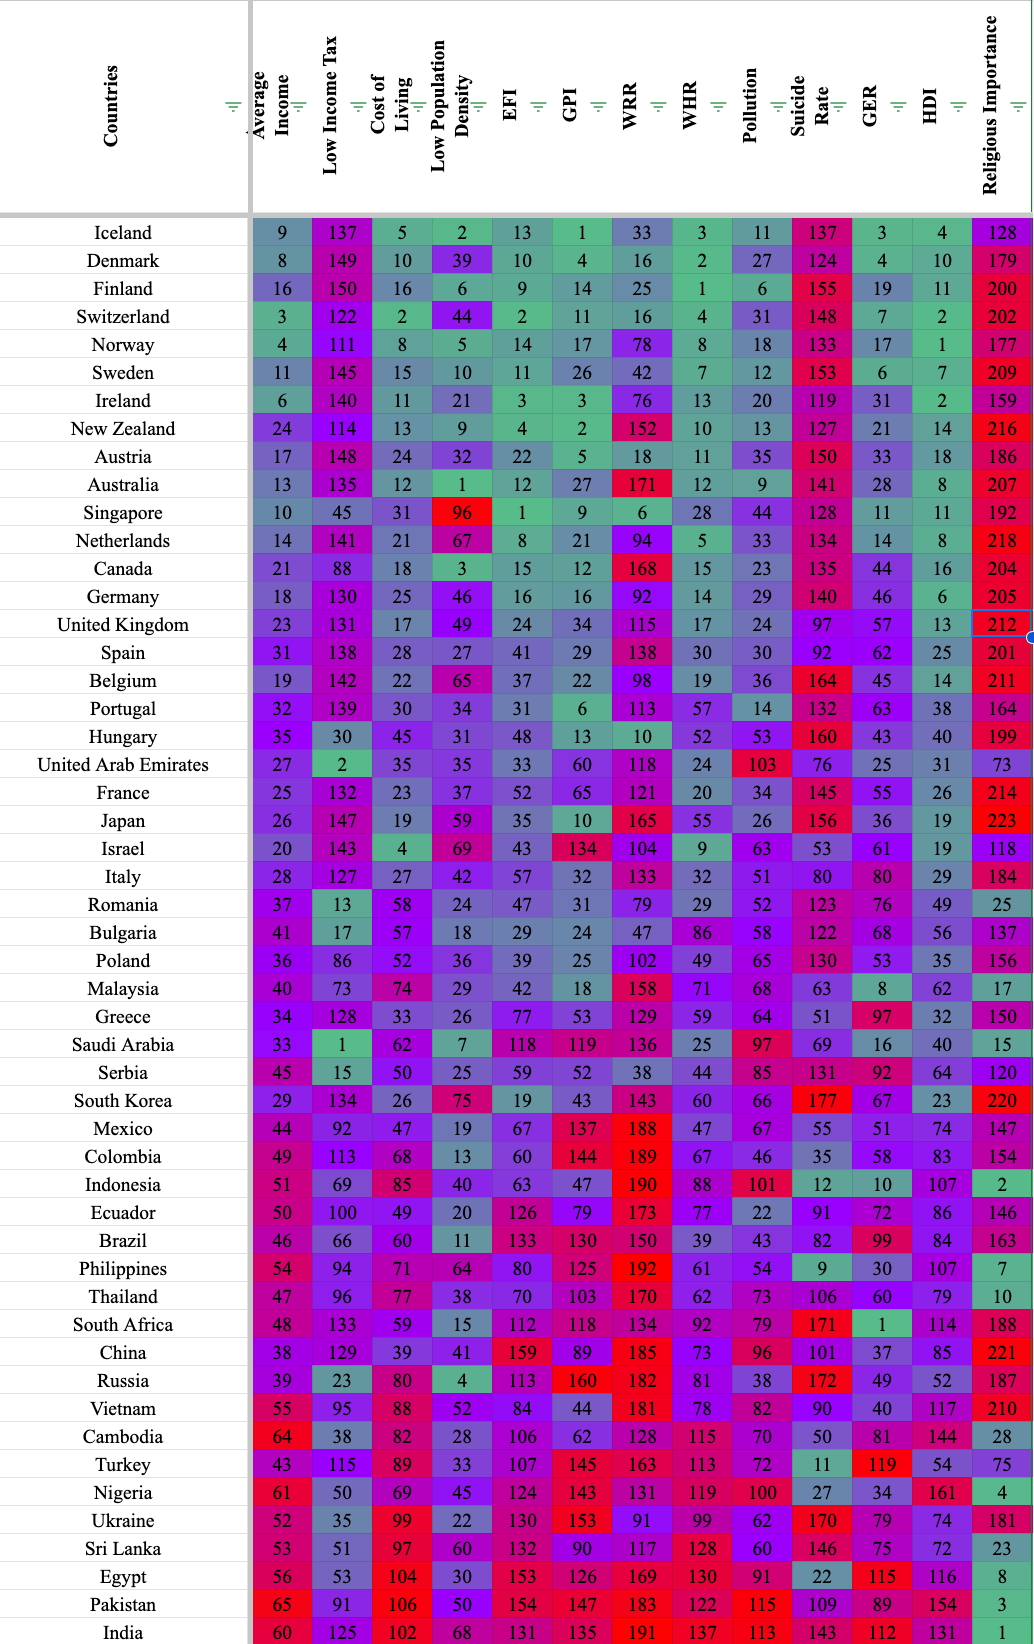
OC [OC] Percentage of people who say that Religion is very or rather important in their life
3.7k
Upvotes
r/dataisbeautiful • u/oscarleo0 • 1d ago
r/dataisbeautiful • u/paveloush • 13h ago
r/dataisbeautiful • u/Fluid-Decision6262 • 5d ago
r/dataisbeautiful • u/Fun-Pace-4636 • 5d ago
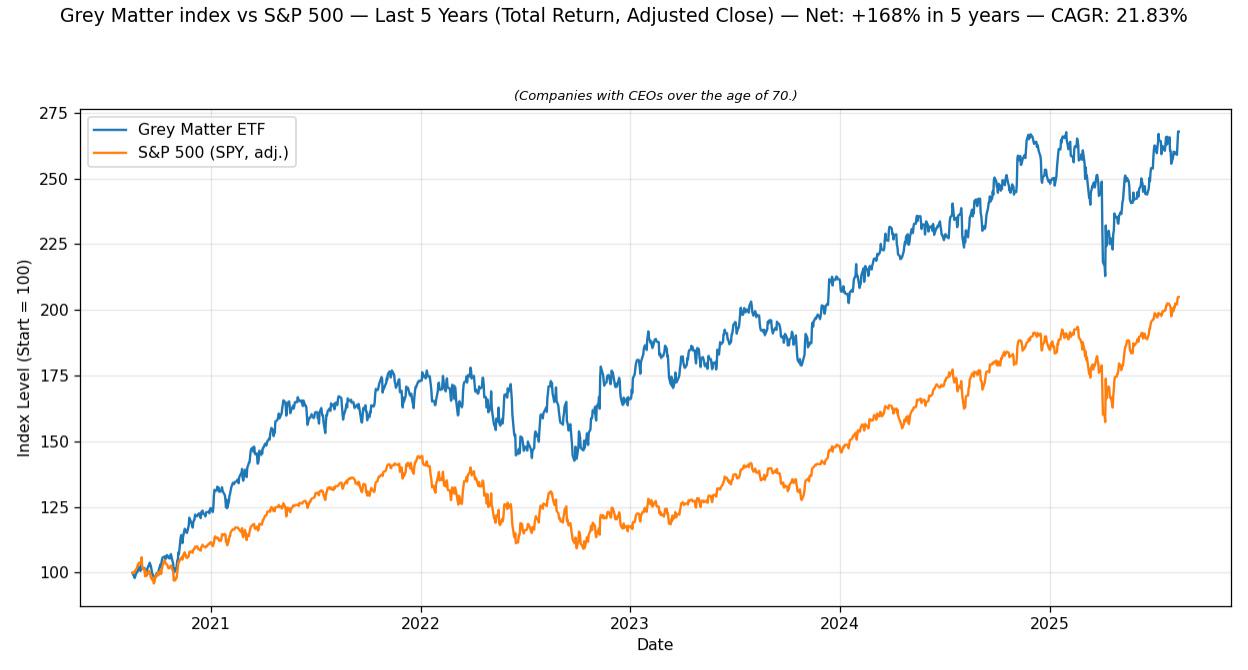
Index made of a mash of companies over the age of 70
r/dataisbeautiful • u/playfulsystems • 6d ago
Over the past few years I’ve been working on a game about copying famous paintings as quickly and as accurately possible with a mouse. While showing prototypes at exhibitions, I saved PNGs of the "forgeries" produced.
I realized that taking the average of the forgeries made of a given painting could be cool—similar to Jason Salavon’s aggregated portraits (whose work I love). I love the ghostly/historical feel of these types of images.
I've also posted an image that includes miniatures of the 256 Mona Lisa forgeries averaged in order of accuracy (i.e., highest scoring at the top left, lowest in the bottom-right). I’ve just started saving brush stroke data too, so I can make time-lapse replays of paintings being made.
I’d love feedback on two things:
Other visualization ideas I should try? I did a sliding-window average that turned out very cool. Aggregating stroke data?
Other types of data I should capture for future data viz or studies? I'd need to implement it soon since it's release is coming in the next few months.
Thanks in advance!
I can share a link to the game in the comments for those curious / if it helps with feedback.
r/dataisbeautiful • u/WargFlow • 6d ago
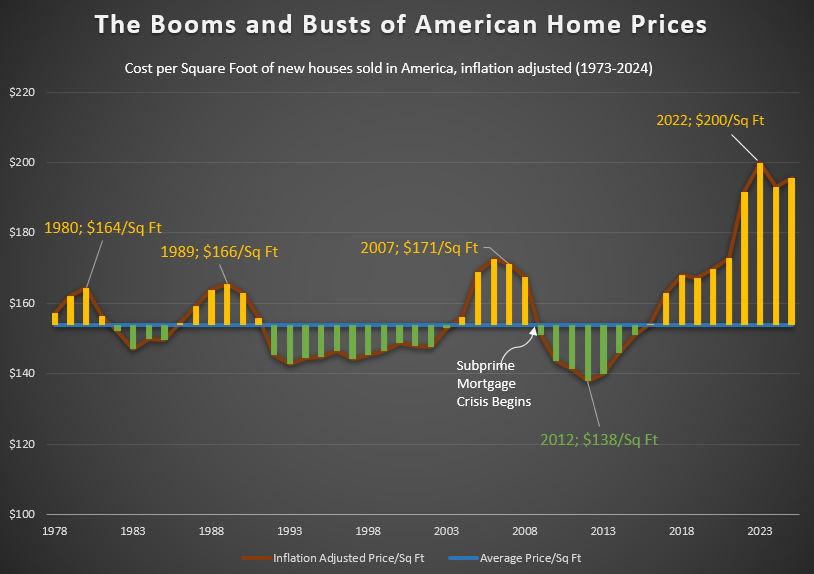
6 Years ago, I posted a graphic about American home prices: https://www.reddit.com/r/dataisbeautiful/comments/dxgshs/the_booms_and_busts_of_american_home_prices_oc/
I have received many requests to refresh the data. Now that the Census data has been released for 2024, I am updating with newly provided information. Values are adjusted for 2024 inflation adjusted dollars. For some reason, I used 2010 inflation adjusted dollars in my last visualization.
Source: https://www.census.gov/construction/chars/current.html
Tools: Excel
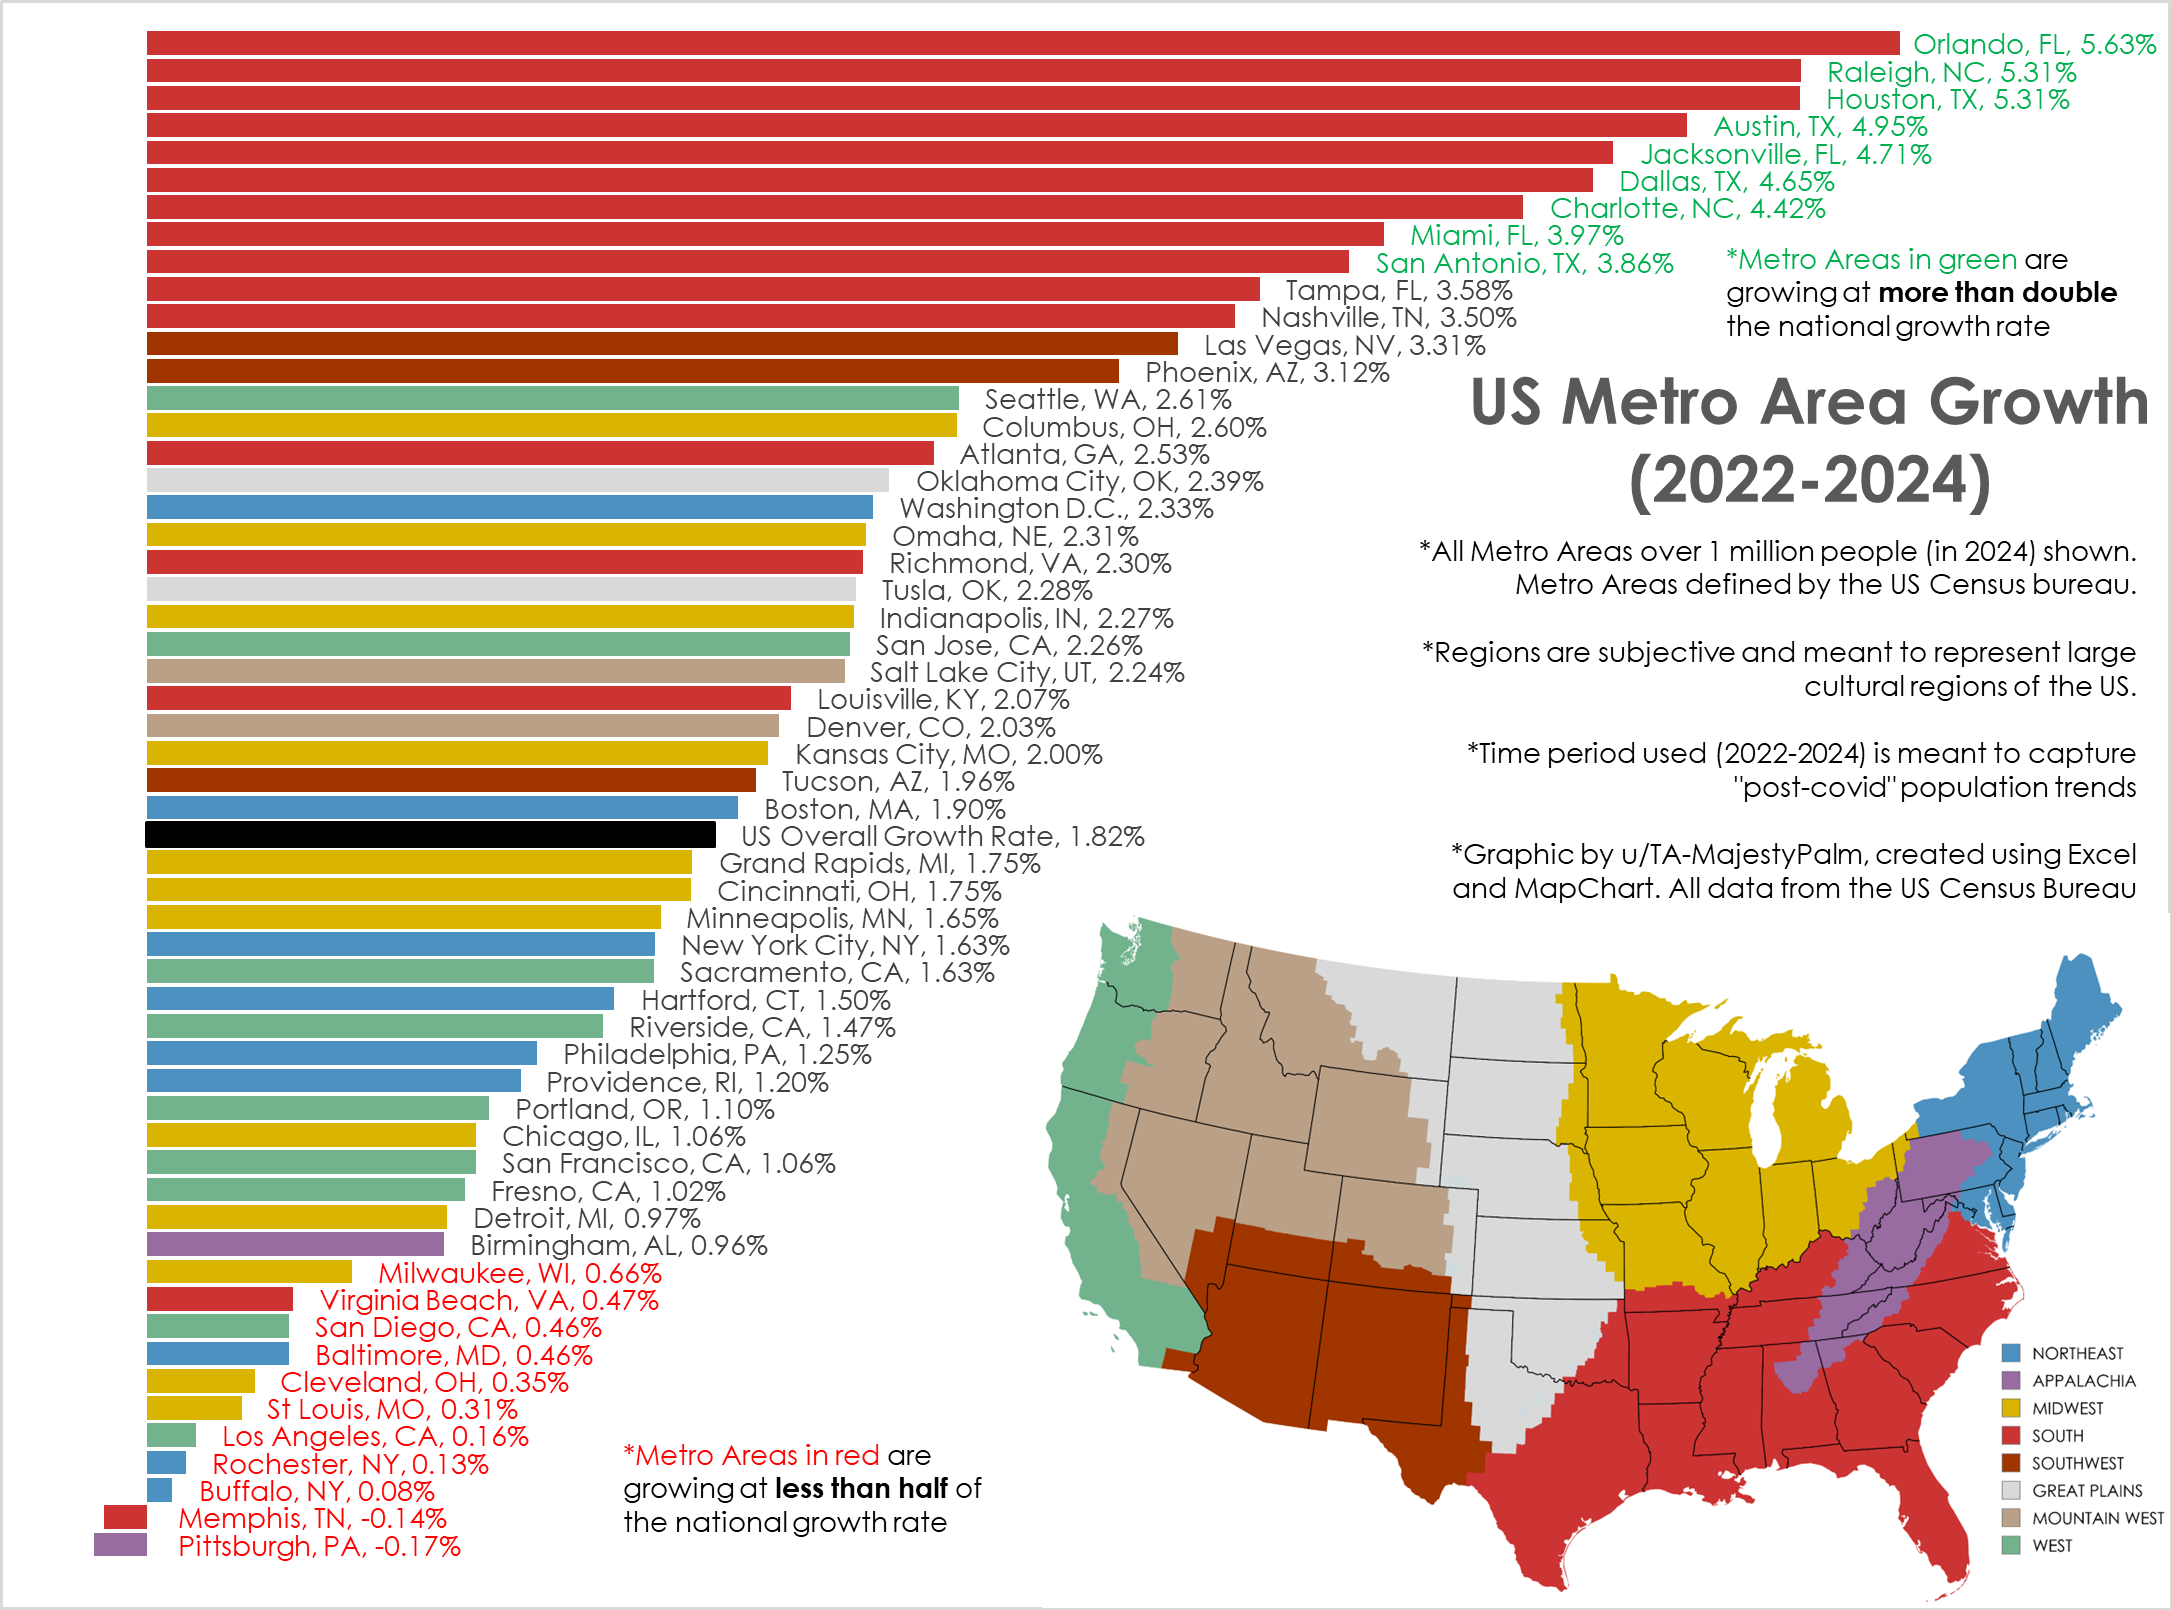
r/dataisbeautiful • u/TA-MajestyPalm • 3d ago
Graphic by me, created in Excel. All data from US Census here: https://www.census.gov/data/tables/time-series/demo/popest/2020s-total-metro-and-micro-statistical-areas.html
I've created similar graphics in the past, but usually from 2020-2024. This is not the best time frame as it combines the abnormal covid years with post pandemic movement.
This time frame (2022-2024) shows the most current and ongoing population trends of the last 2 years.
I also wanted to better categorize the cities into broad cultural regions vs the arbitrary geographic census regions.
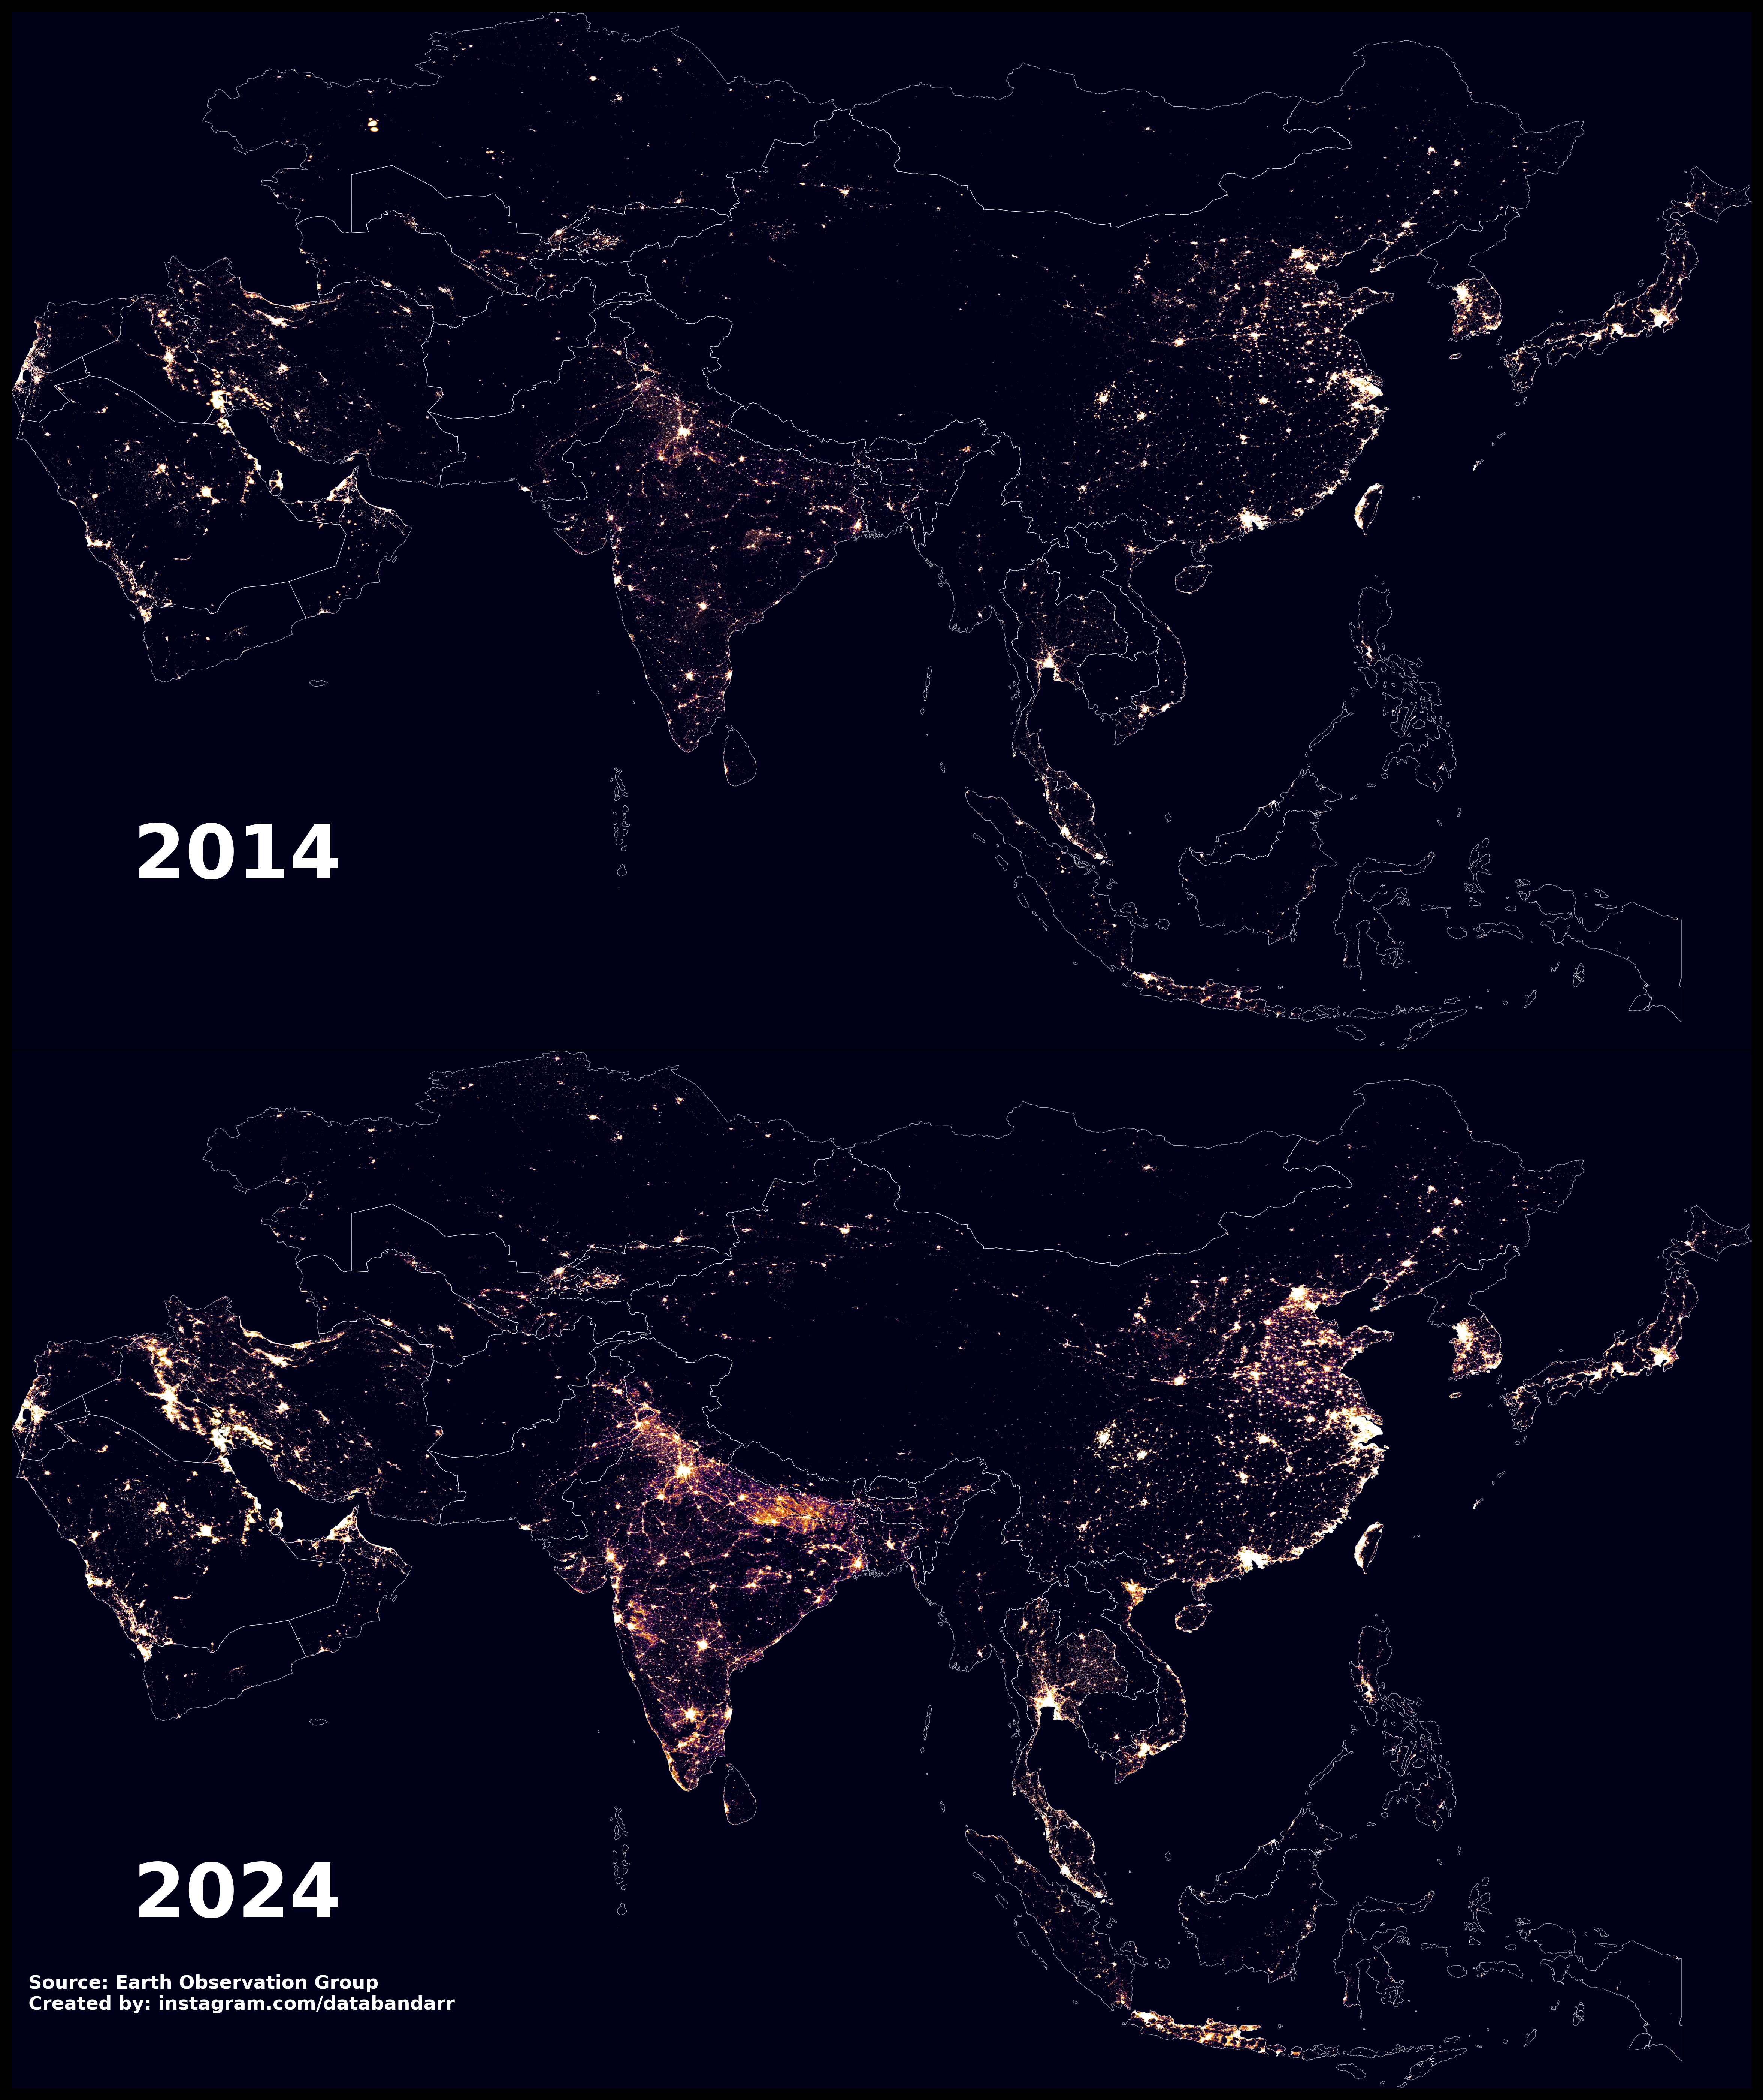
r/dataisbeautiful • u/ramnamsatyahai • 2d ago
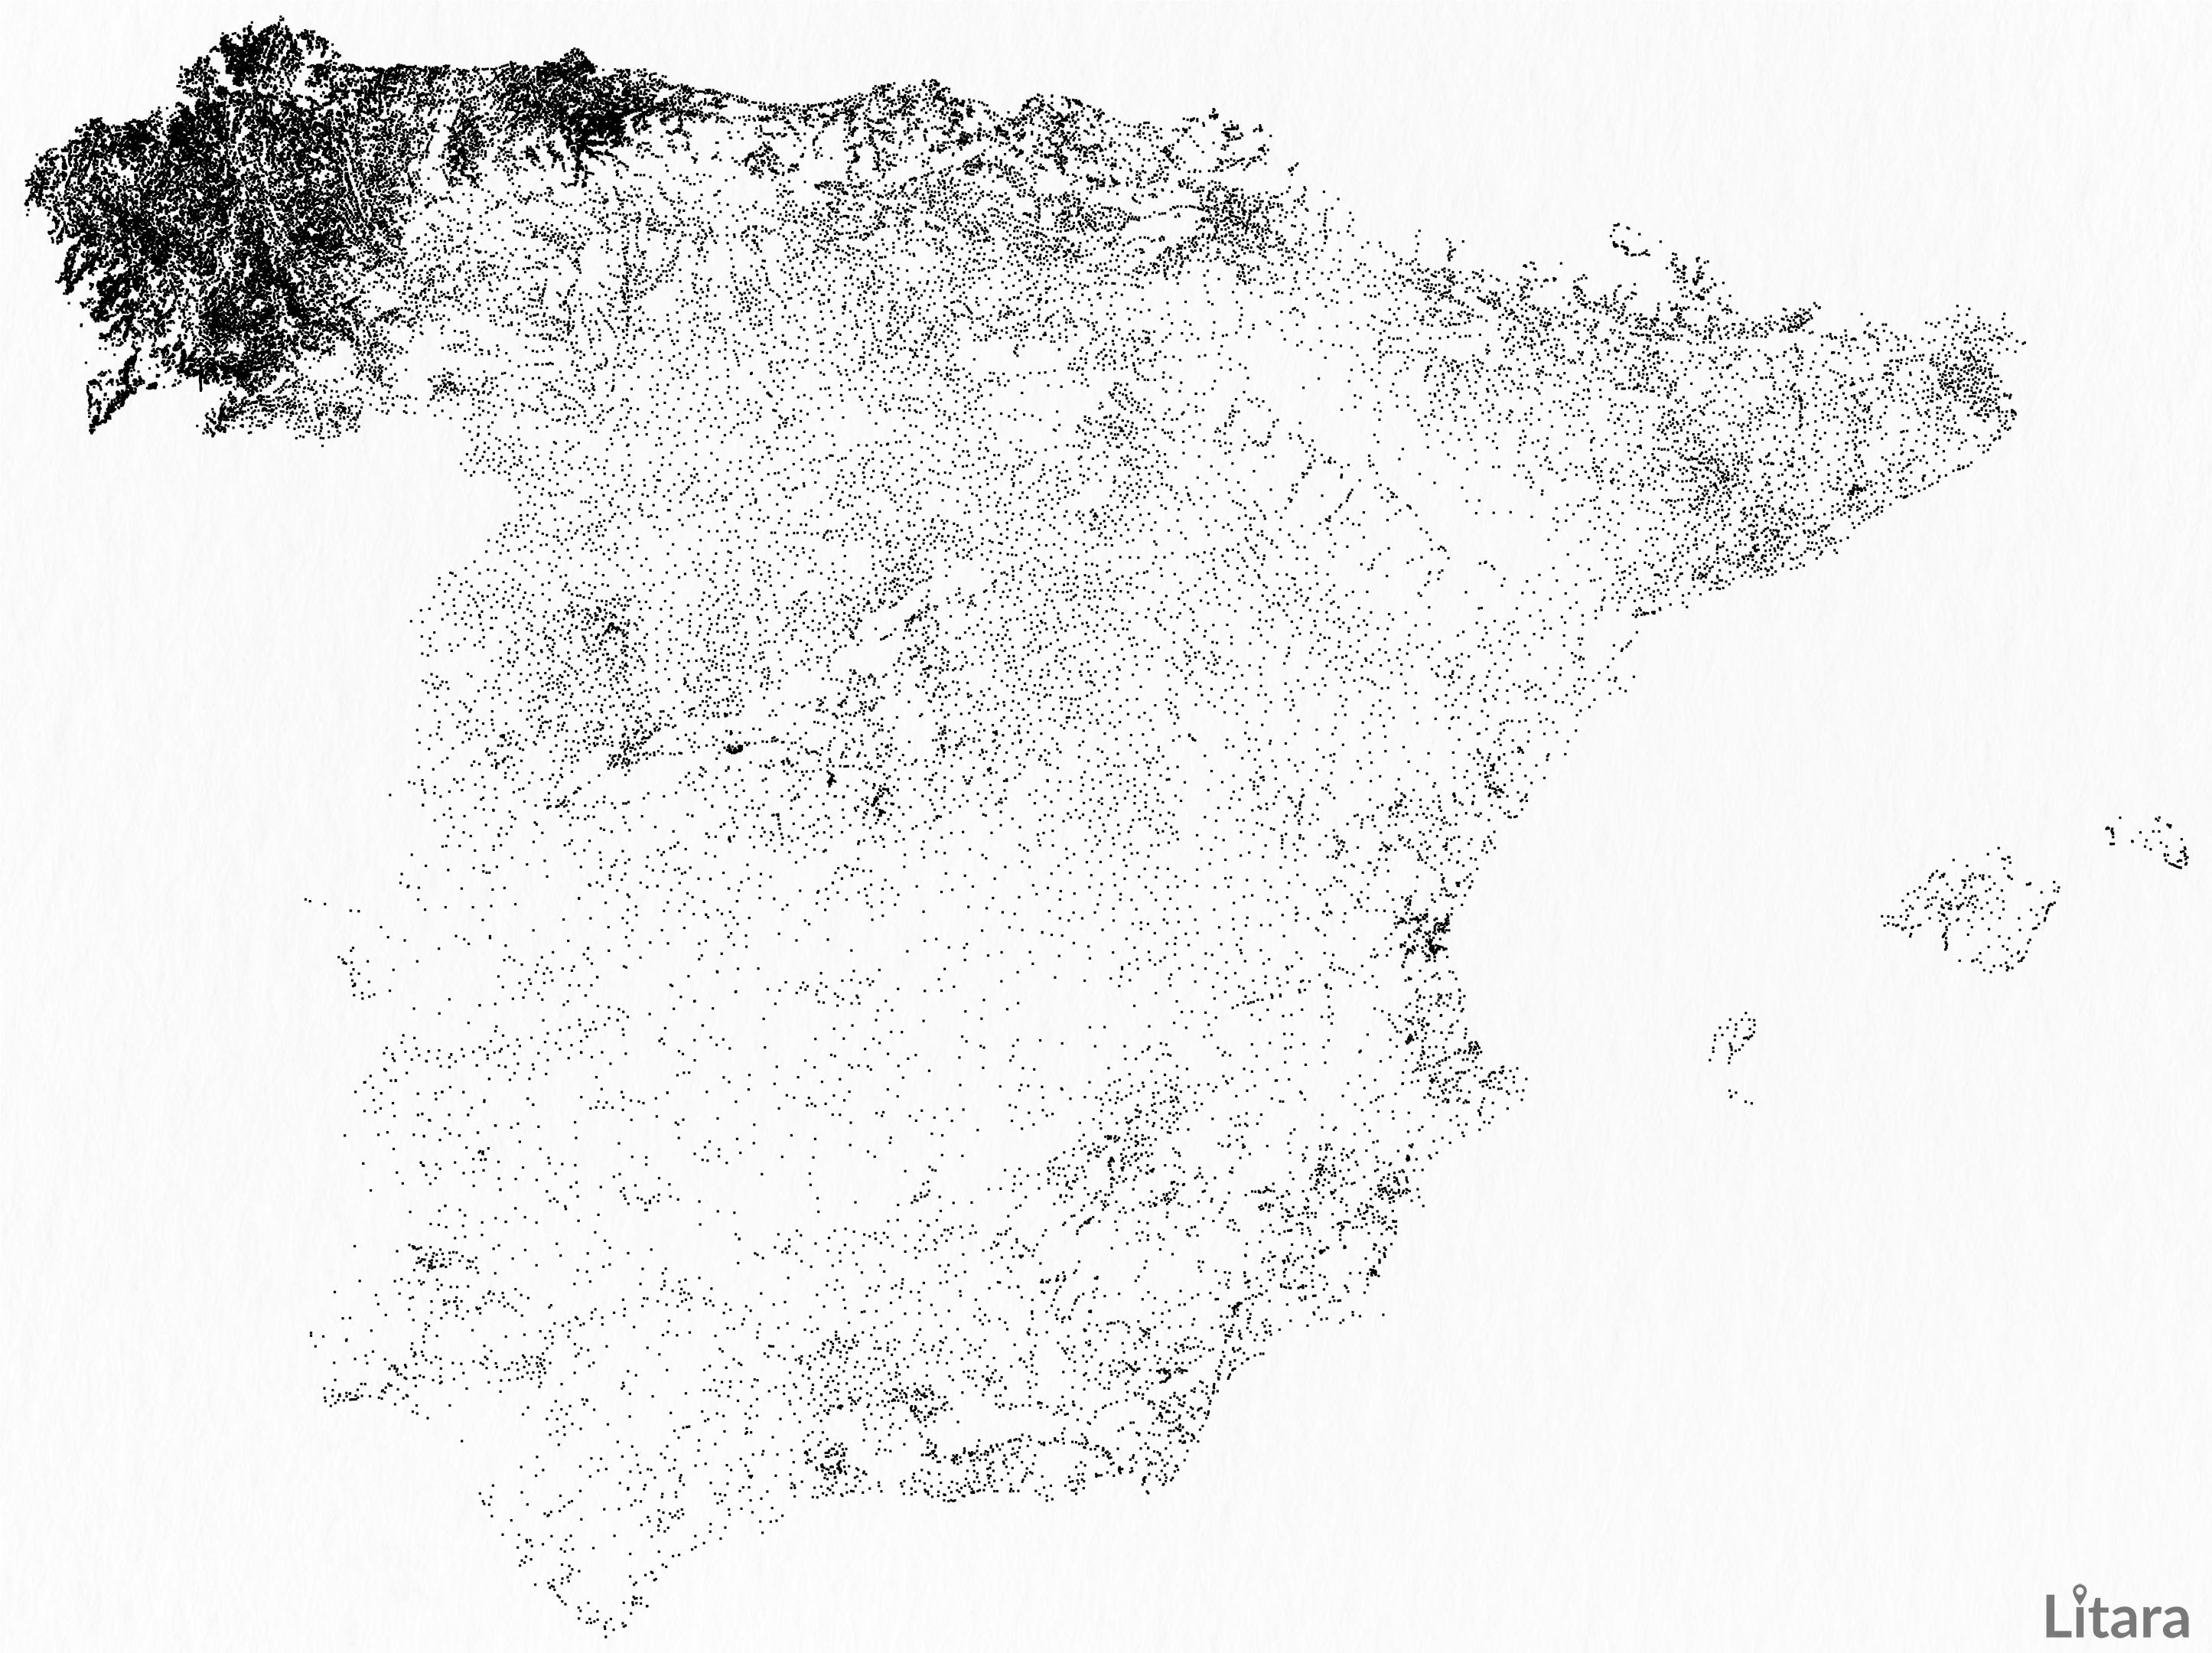
Reposting with updated data , the 2012 composite used a different method and partial coverage, which made some regions (like Thailand) appear darker. This version uses average annual masked VIIRS data for a fairer 2014–2024 comparison.
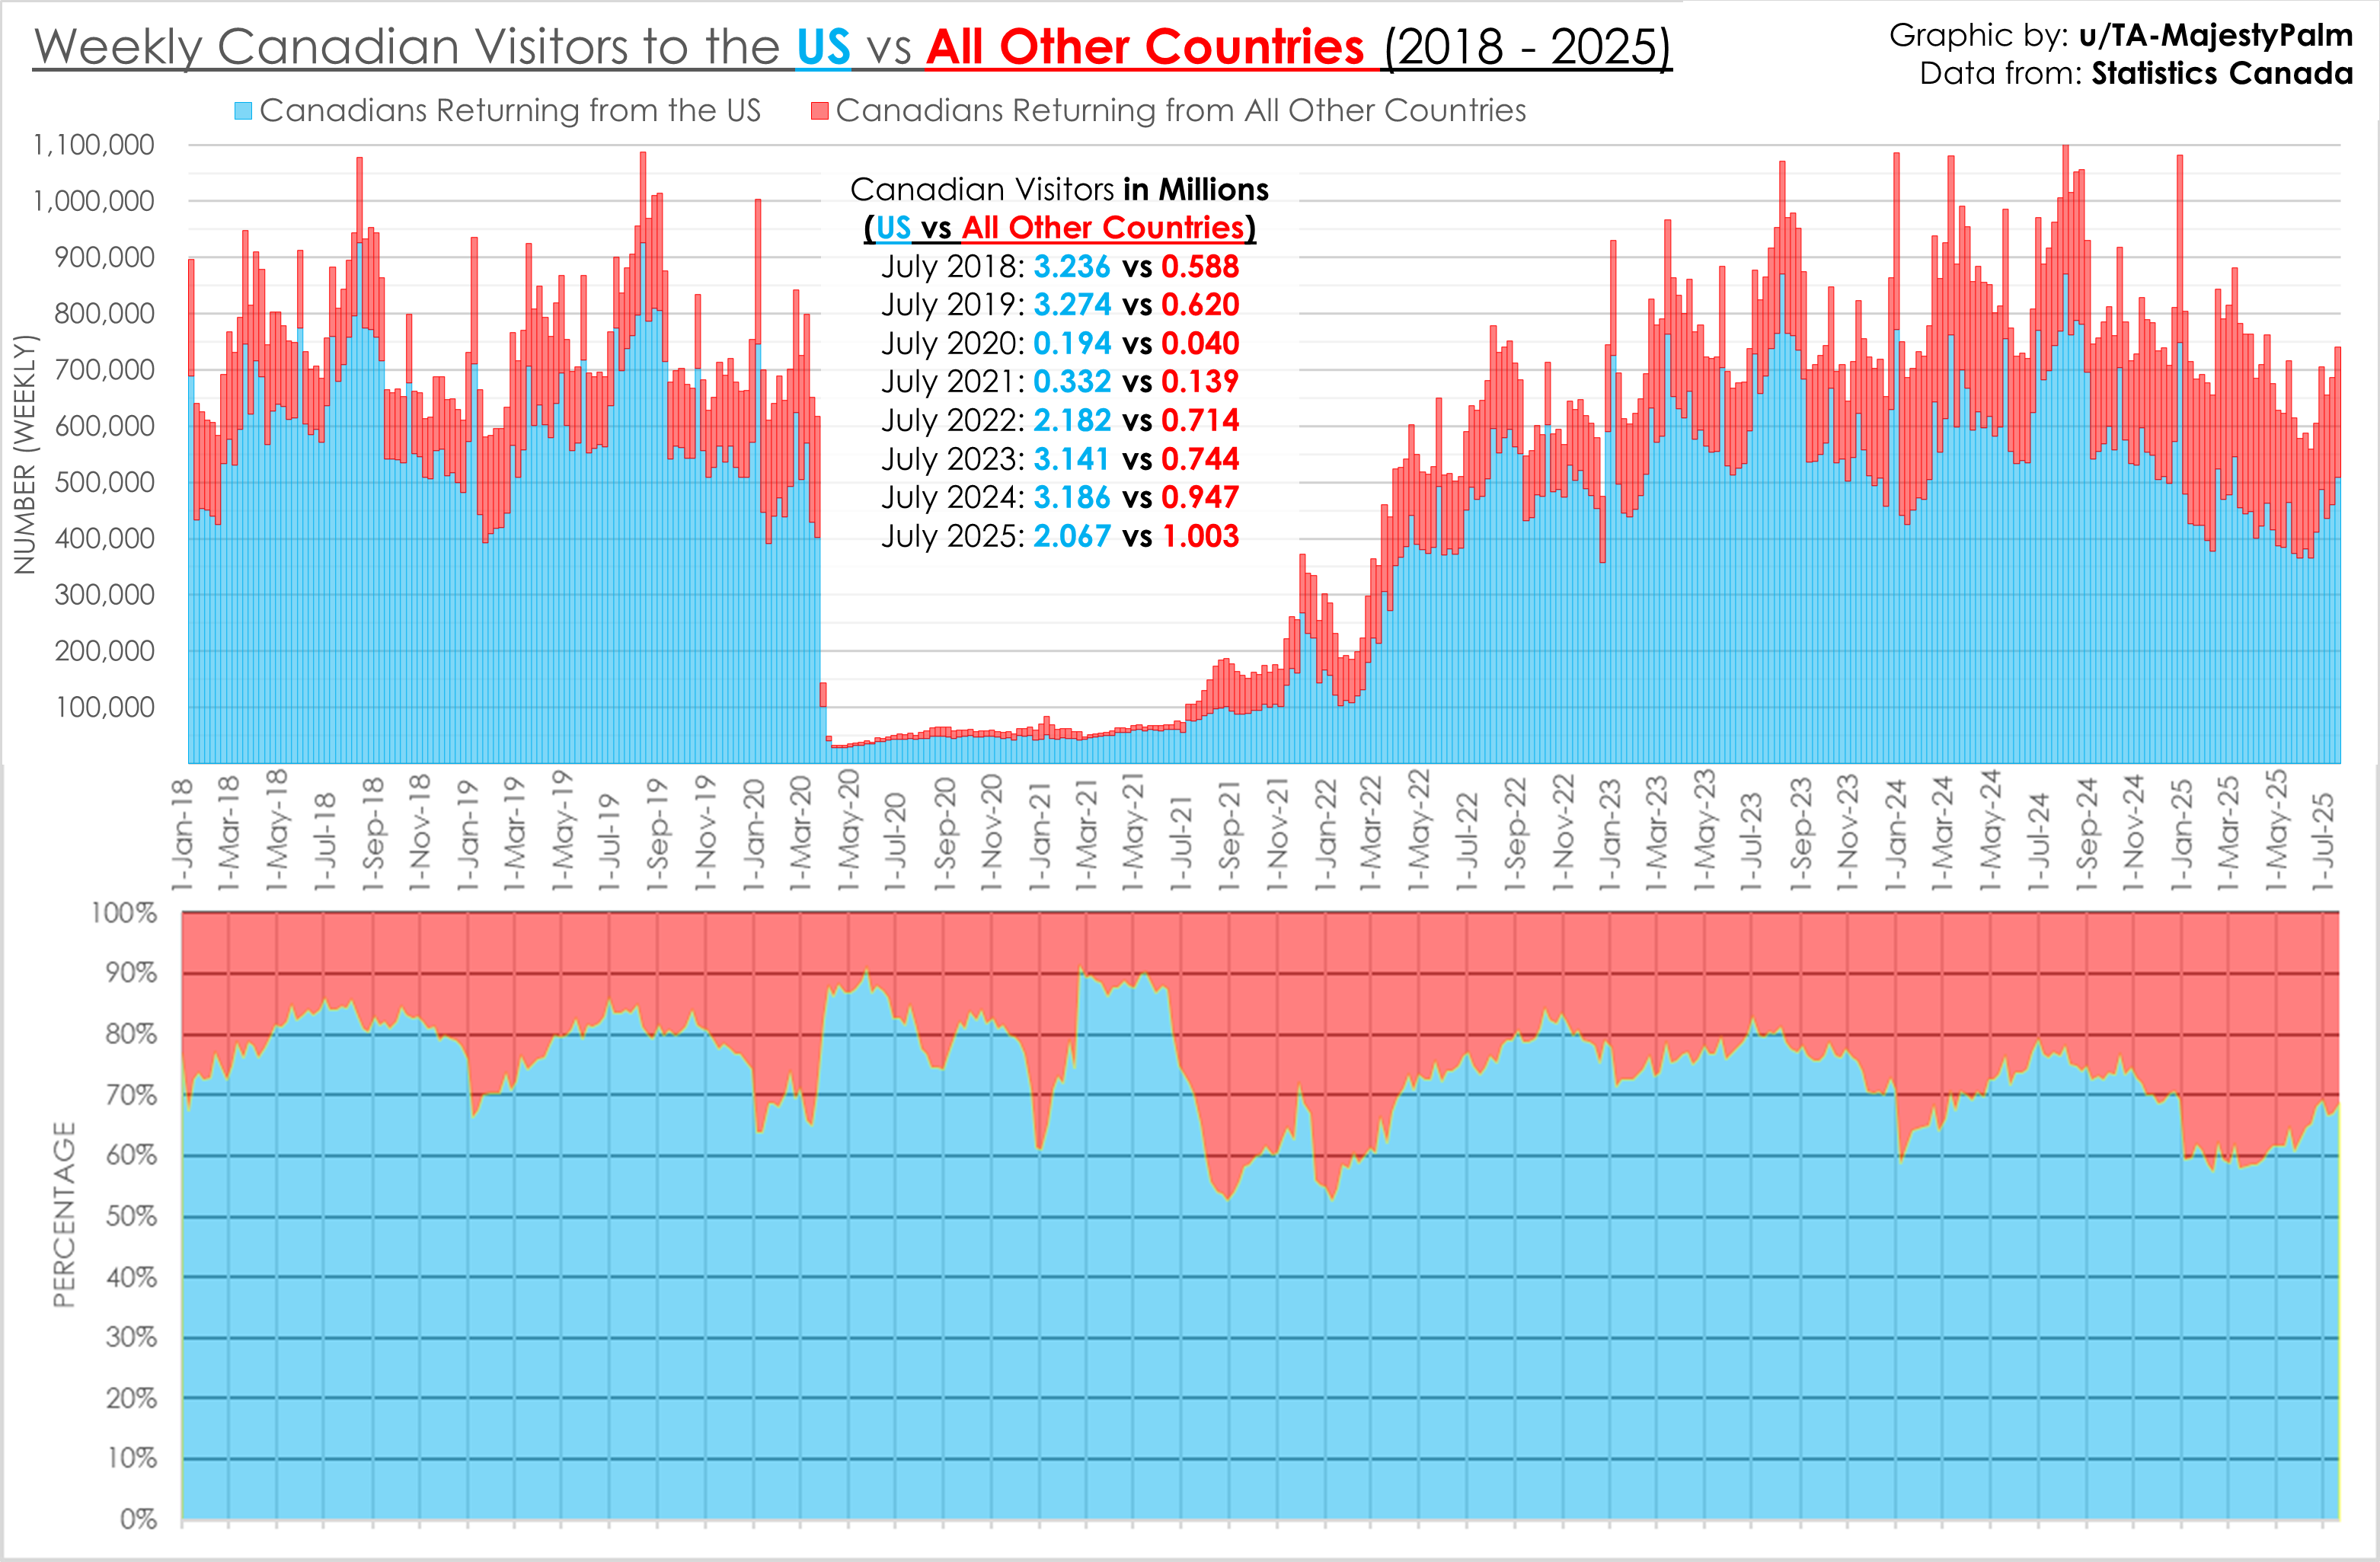
r/dataisbeautiful • u/TA-MajestyPalm • 5d ago
Yesterday I created a graphic showing Canadian visitors to the US over time, today I wanted to expand that topic by also showing Canadian visitors to all other countries.
The top graph is raw numbers by week, the bottom graphic is the percentage of US vs non US travelers. I also included total July numbers for every year in the top graphic for reference.
Created with excel. US data is combined automobile crossings and air, all other countries are air only.
Sources: https://www150.statcan.gc.ca/t1/tbl1/en/cv.action?pid=2410005701 And https://www150.statcan.gc.ca/t1/tbl1/en/cv.action?pid=2410005601
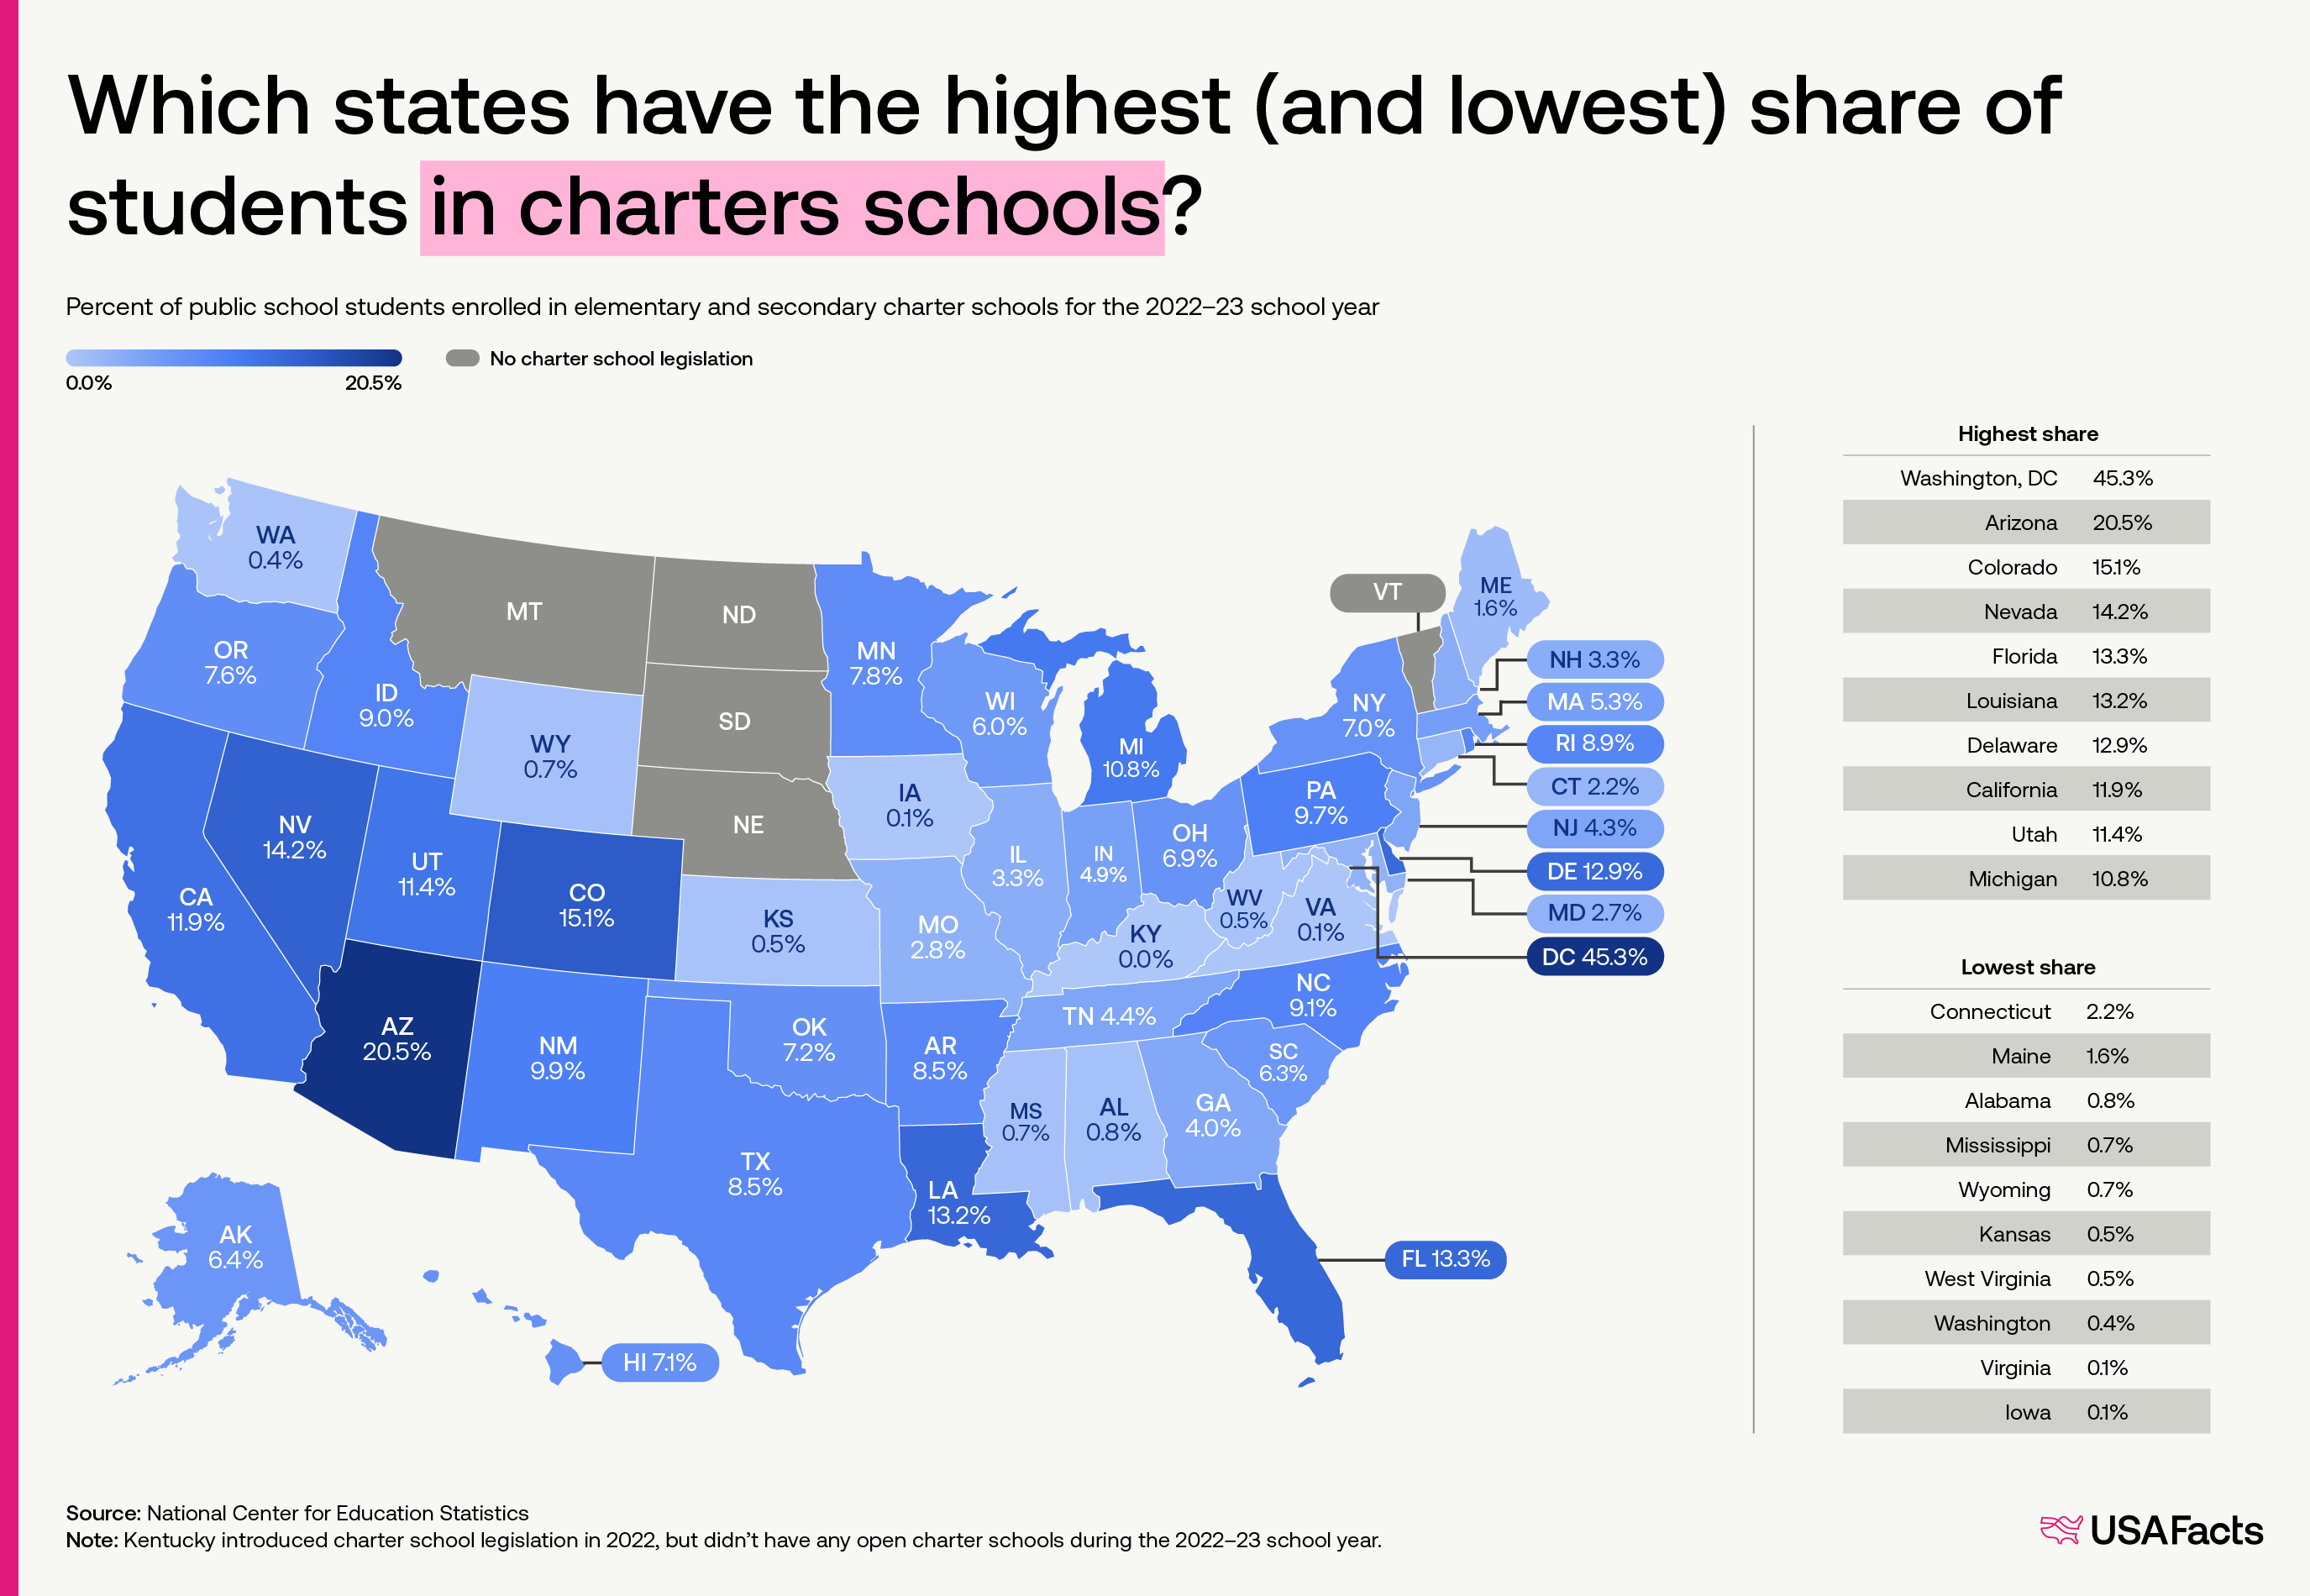
r/dataisbeautiful • u/USAFacts • 2d ago
r/dataisbeautiful • u/Data_digger1 • 3d ago
r/dataisbeautiful • u/_crazyboyhere_ • 3d ago
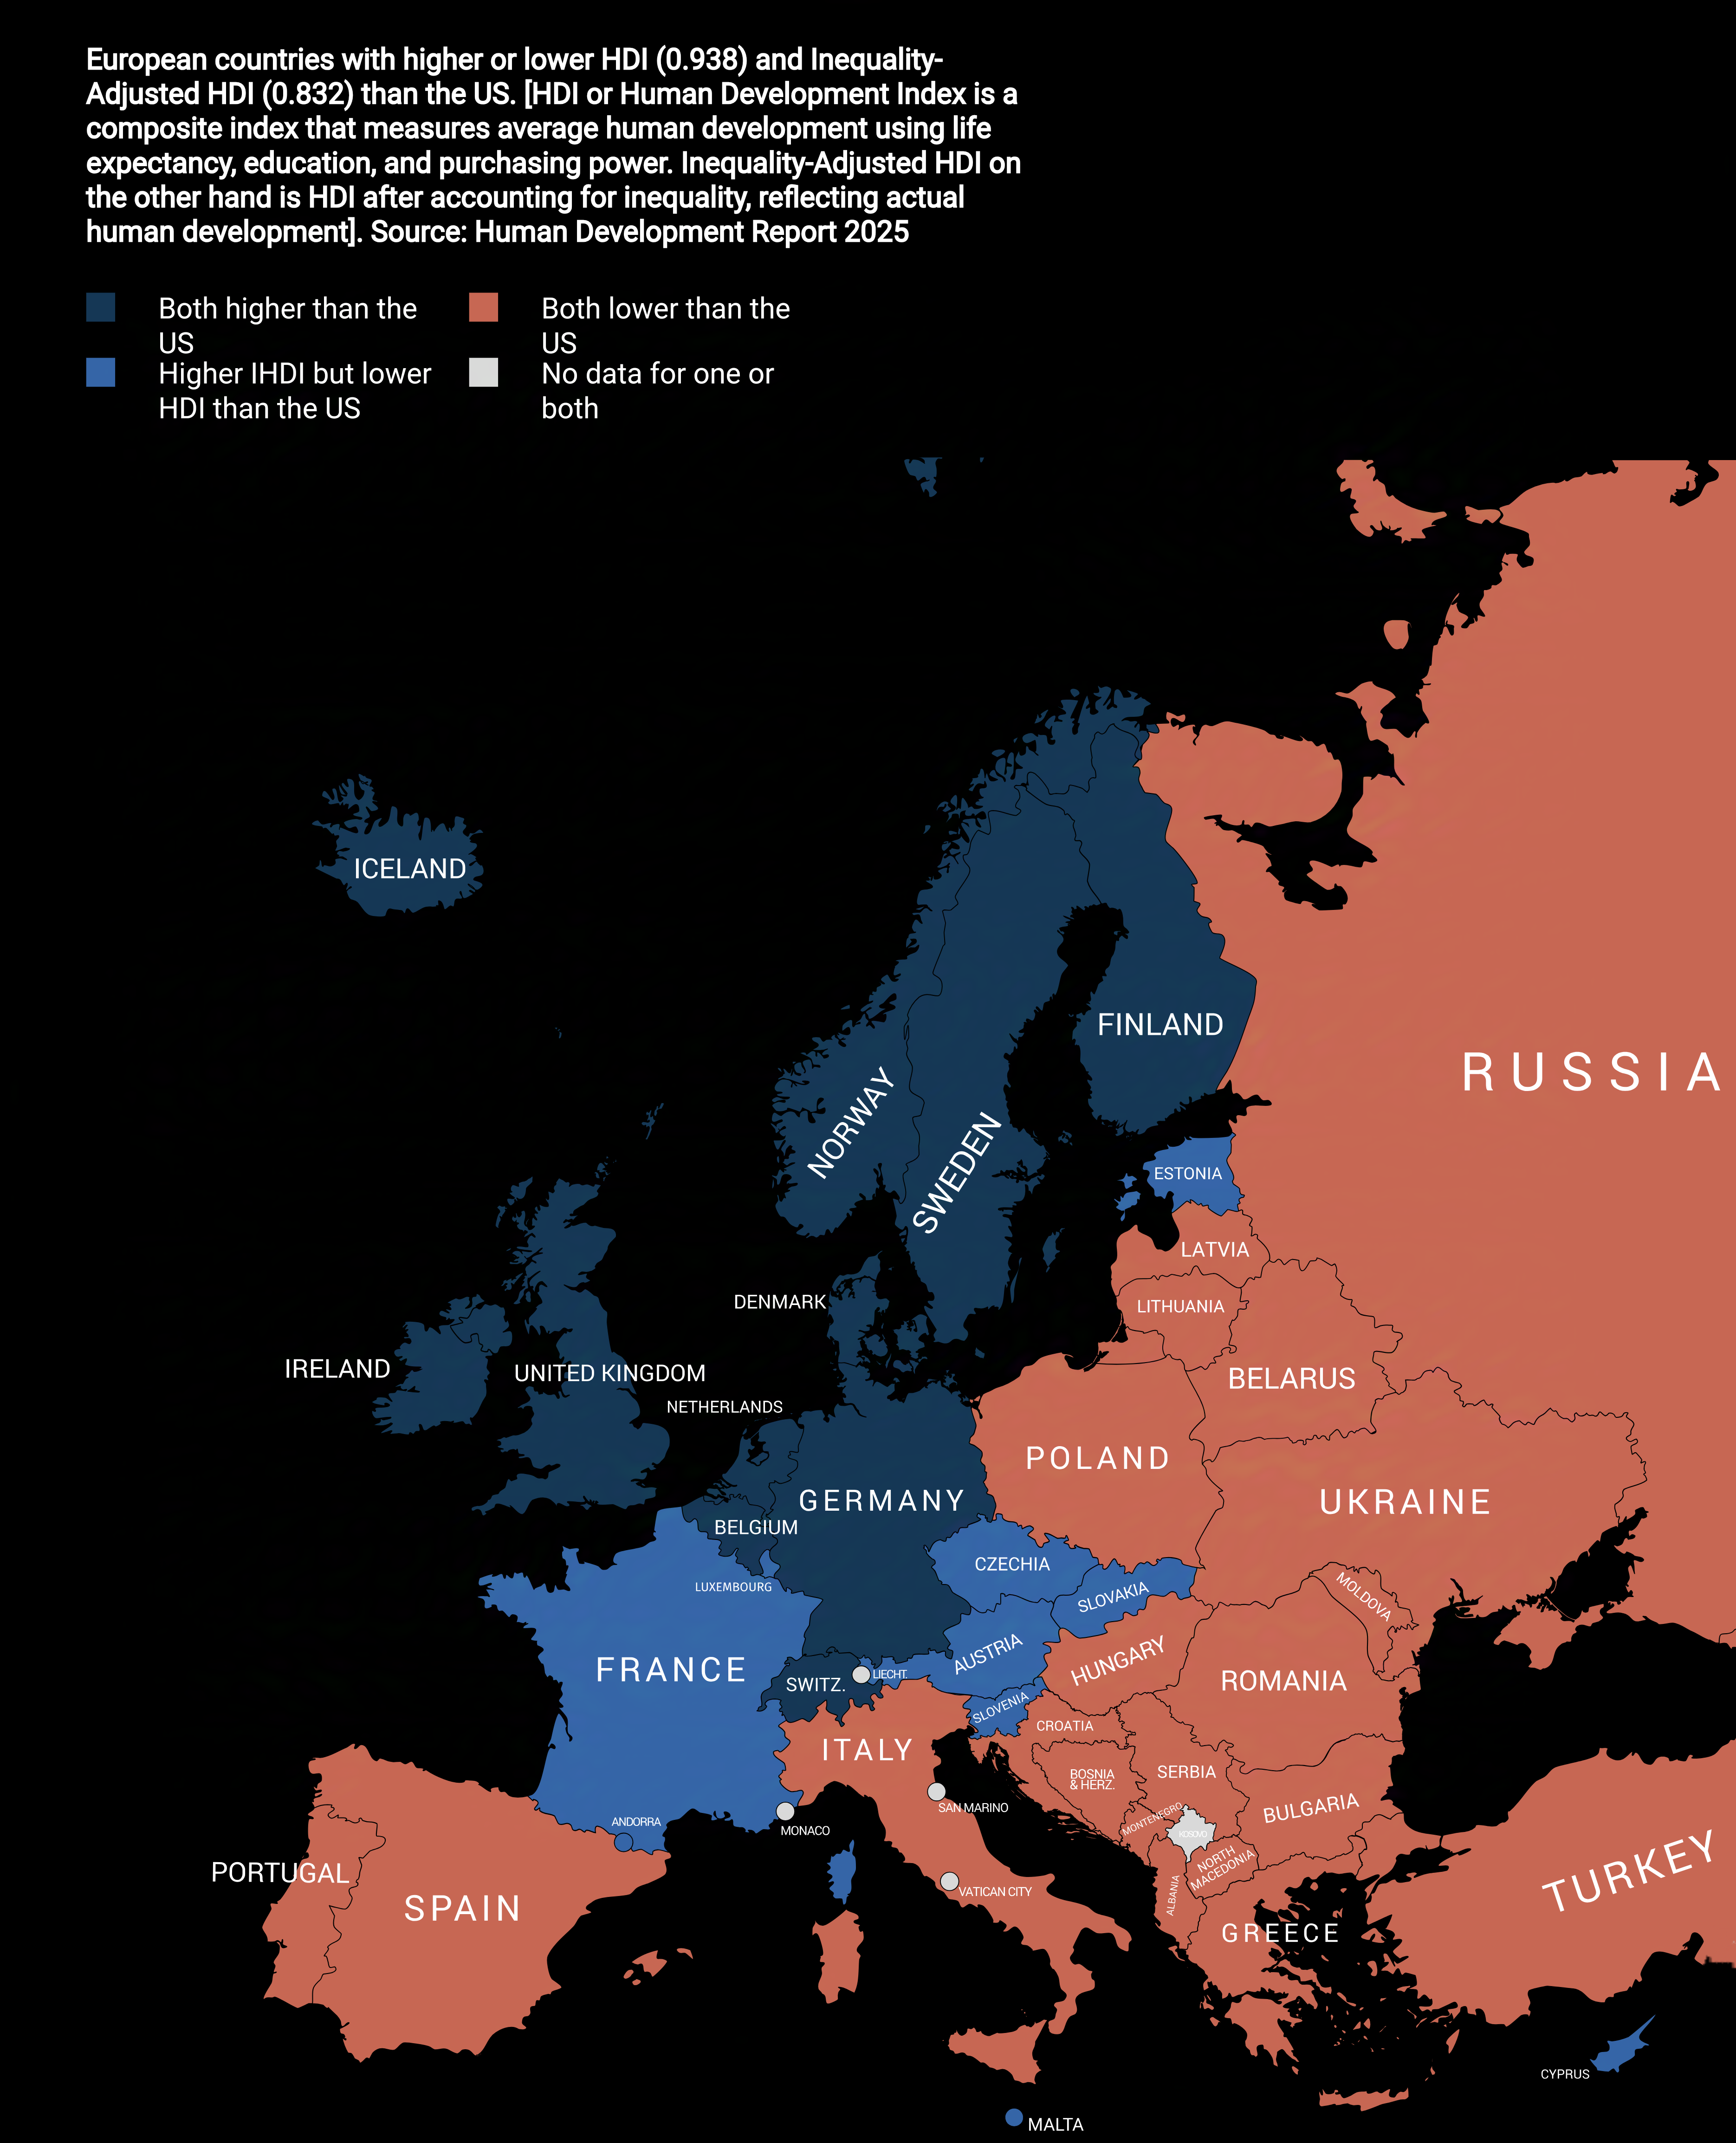
r/dataisbeautiful • u/Proud-Discipline9902 • 2d ago
Methodology & scope:
r/dataisbeautiful • u/ANTrixSTAR • 6d ago
r/dataisbeautiful • u/agprime19 • 6d ago
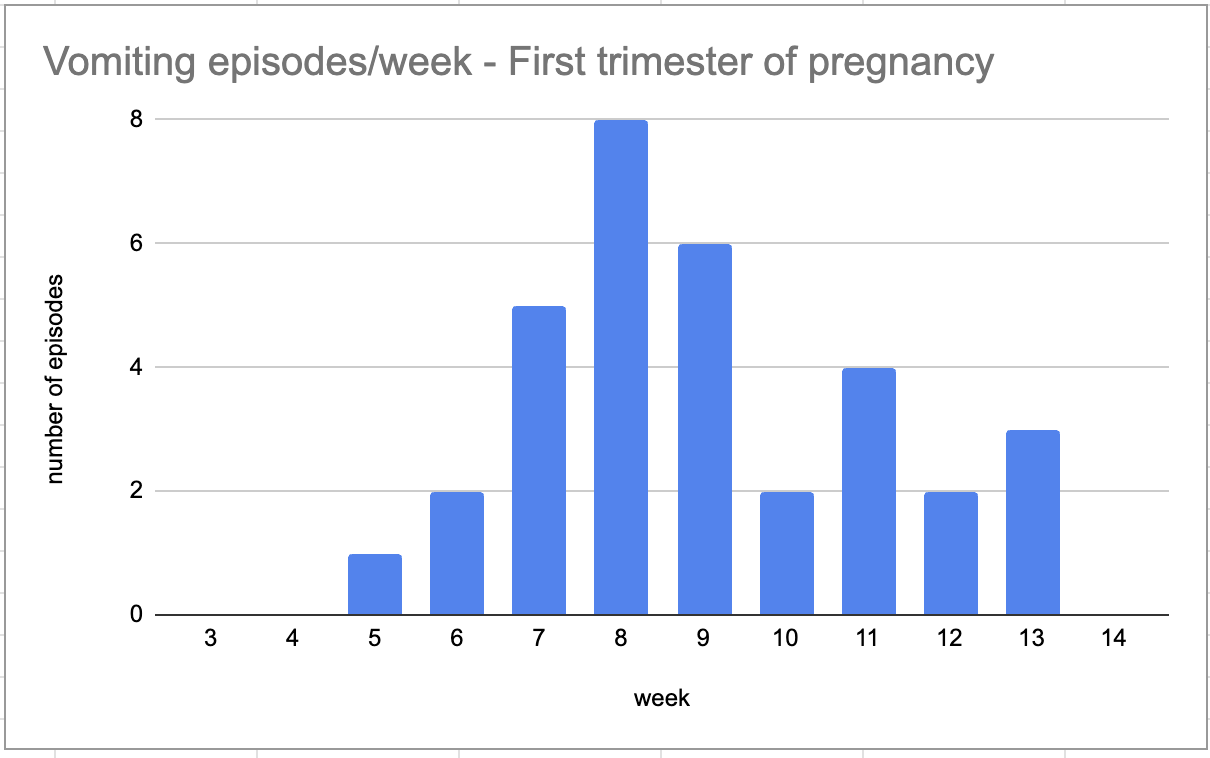
During my last pregnancy, I was even sicker but never took the data -- this time, I decided to record. FWIW, there was another vomiting episode in week 18-19, but I'm limiting this to first tri only.
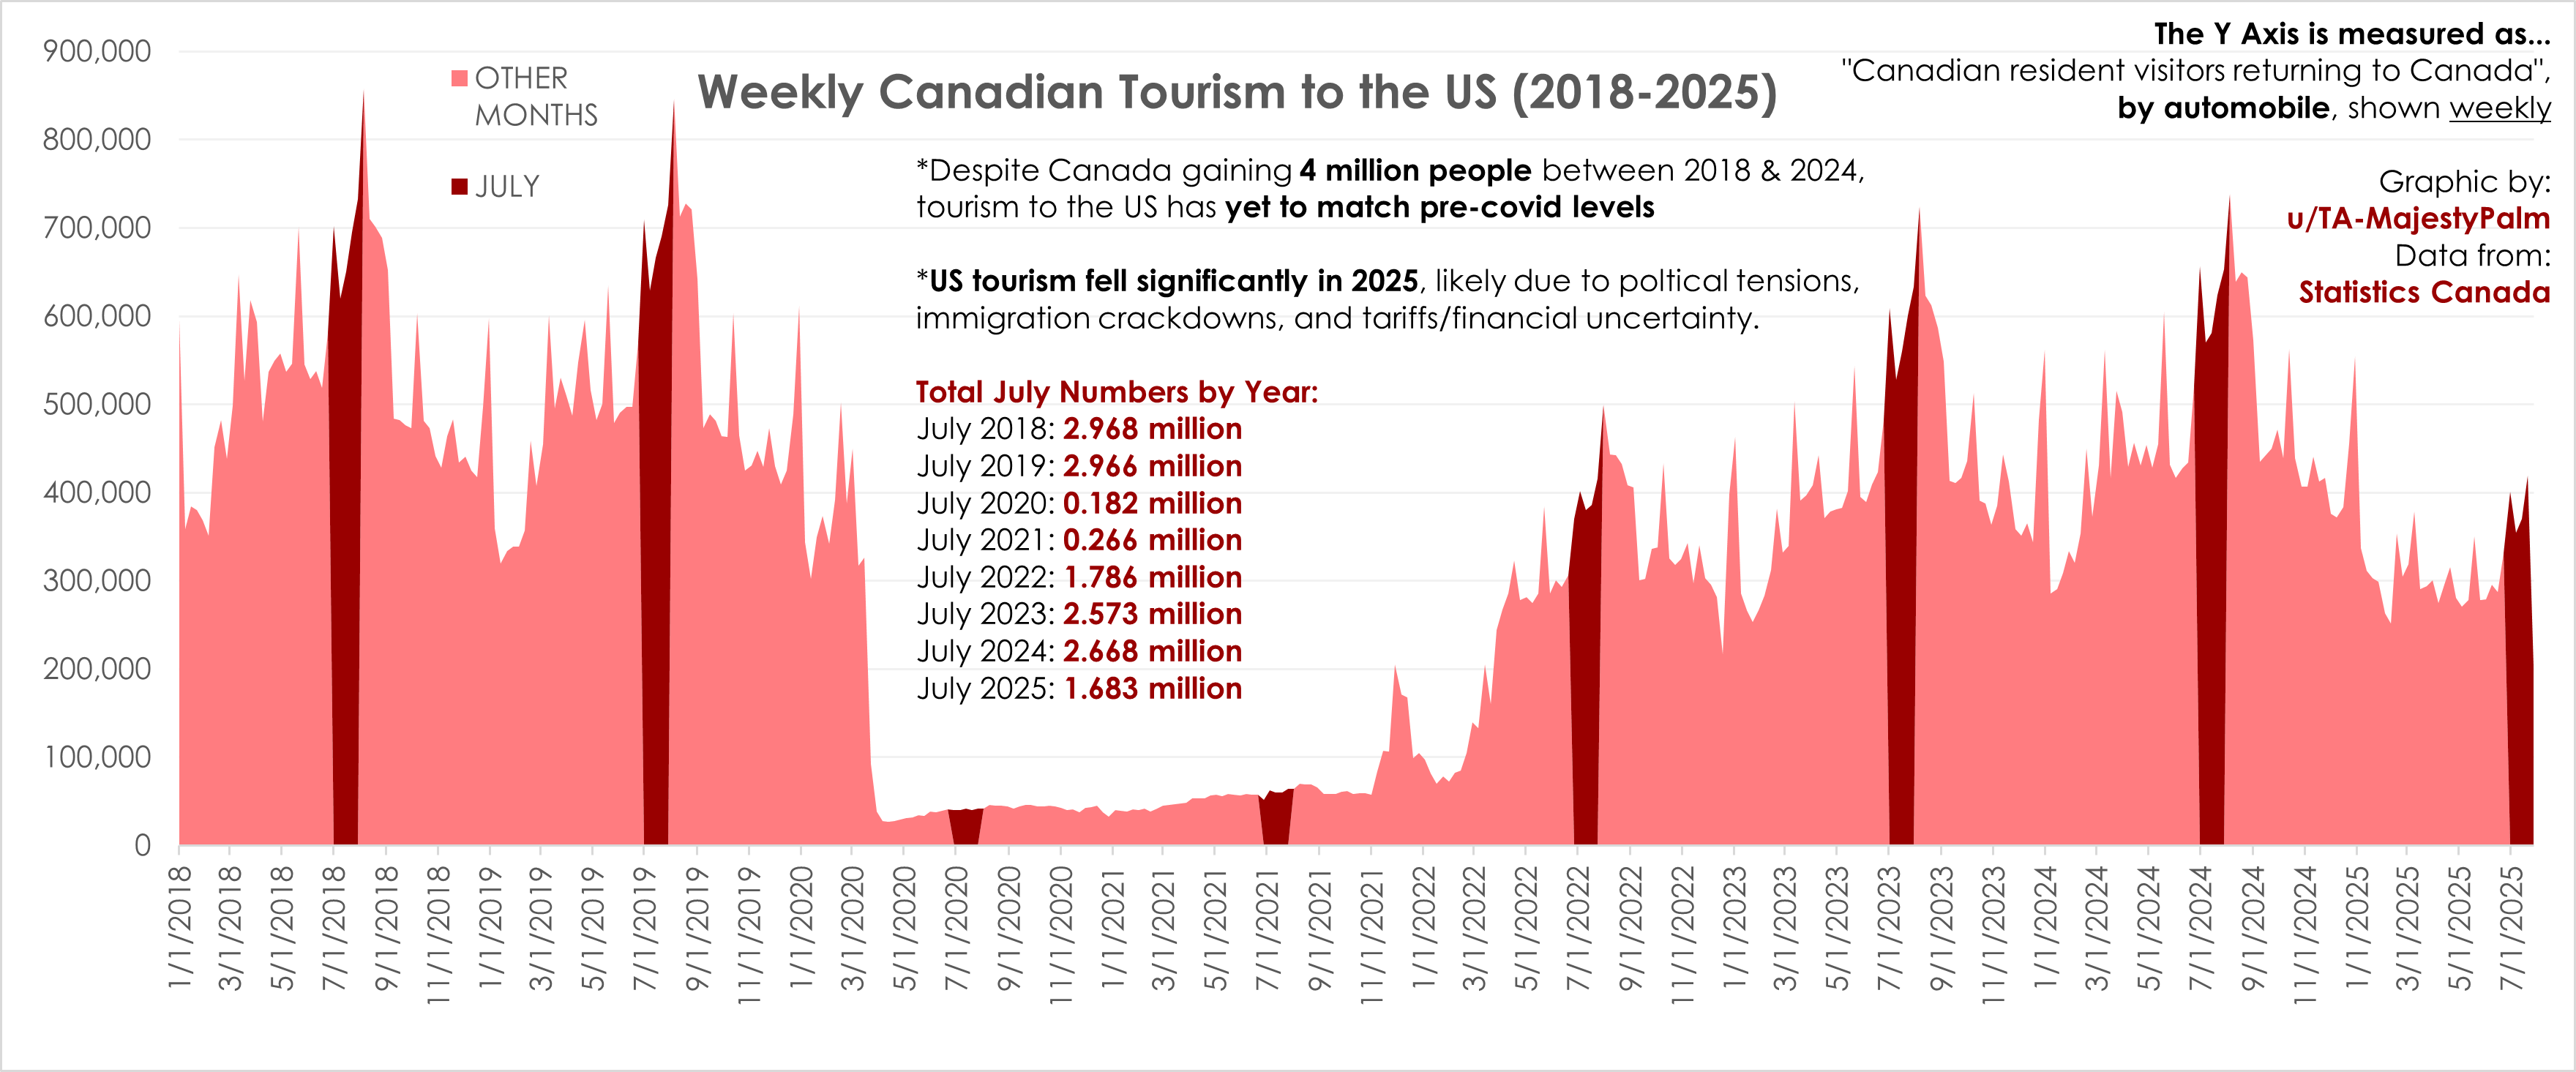
r/dataisbeautiful • u/TA-MajestyPalm • 6d ago
Graphic by me, created in Excel.
Source: https://www150.statcan.gc.ca/t1/tbl1/en/cv.action?pid=2410005701
As a trending news topic I wanted to investigate for myself how much Canadian Tourism to the US has recently declined, and how this compares historically.
The data source I used gives the daily number of Canadians returning from the US by car - I converted this to weekly totals as the daily graph had a lot of variance and was harder to read.
I highlighted every July for easier comparison.
r/dataisbeautiful • u/Best-and-Blurst • 6d ago
Phone GPS data from my last cycling trip, which was aborted after an unanticipated encounter with a physical object of roadway non-conformance, resulting in aerial excursion and rapid uncontrolled deceleration.
Hit a rock in the middle of the cycle lane and fell off my bike.
The phone was in my pocket at the time, so all motion tracks me and not the bike. Since after a certain point in the journey we parted company.
I also did not see the rock at all, so there was no braking or loss of speed before impact. In fact, I was still getting faster due to clearing the brow of the hill. Speed would have topped out at 45kph if I'd encountered the rock any further downhill.
Dislocated shoulder with a small fracture and plenty of road rash. Wear a helmet, because I did and it definitely prevented much more serious injury.
r/dataisbeautiful • u/Odd-Entertainer-6234 • 4d ago
Created using matplotlib, pandas for some basic data restructuring, curl to download the data, pycurl to automate some of the process.
Source of the data is awt.cbp.gov from August 19th 2022 to August 18th 2025. Their policy is to make data of the last 3 years available, regardless of how much they have collected. I filtered out August 2025 data, as well as any data from 2022, since they were incomplete.
I often see rhetoric that the US visitor numbers are down this year, both in the news and by redditors who are in the industry (airports, hotels, restaurants and other tourism adjacent workplaces). I would also expect the numbers to be down, but I was curious about the numbers. I then remembered about the AWT website that I often use for travel purposes. I typically use it because I get anxious about immigration wait times, after an especially long wait time at JFK. While it provides a breakdown of average wait time for US citizens and non-US citizens, it also gives the number of flights that landed in the hour, as well as a very rough curve on the wait time (in units of 15 minutes), all in graphical format. It has been very useful to estimate immigration wait times at airports for me. Hopefully access to this information is not removed.
Analyzing the data has revealed a mixed bag; it's not easy to conclude anything from this data but there are certain correlations you can observe. I will note caveats first:
Because of all these issues (that I only thought about after looking at the data), I was discouraged to find inconclusive results. Nevertheless, since I already generated this graph, I wanted to go ahead and share it. Please leave feedback on the visuals, and if you find any anomaly. I have double checked manually if the graph is accurate to the data, but you never know.
So what are the results from what I observe?
All airports here: US Airport Visitors
Let me know if you observe any other interesting aspect to the data.
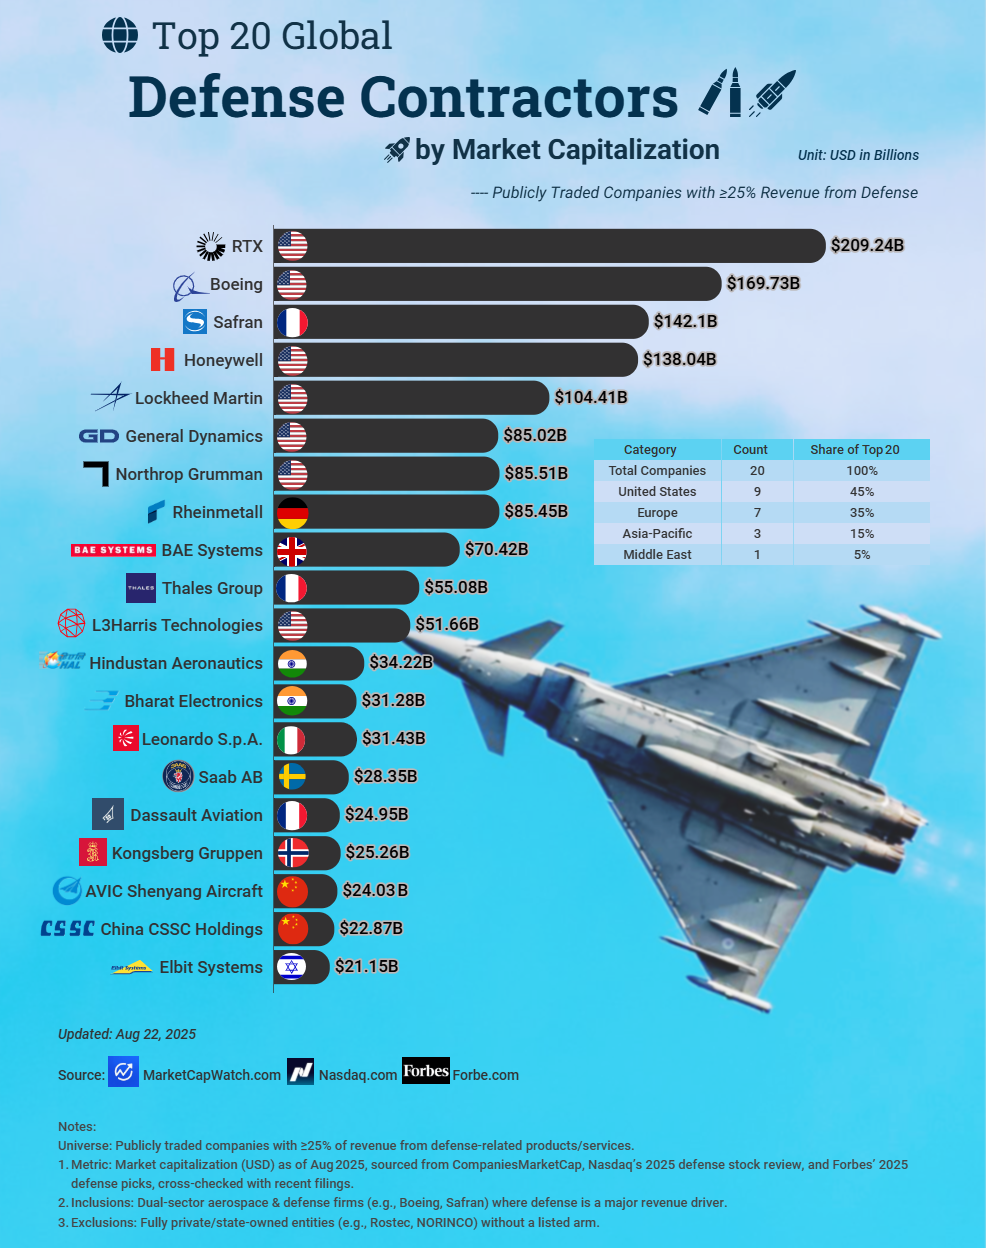
r/dataisbeautiful • u/Proud-Discipline9902 • 6d ago
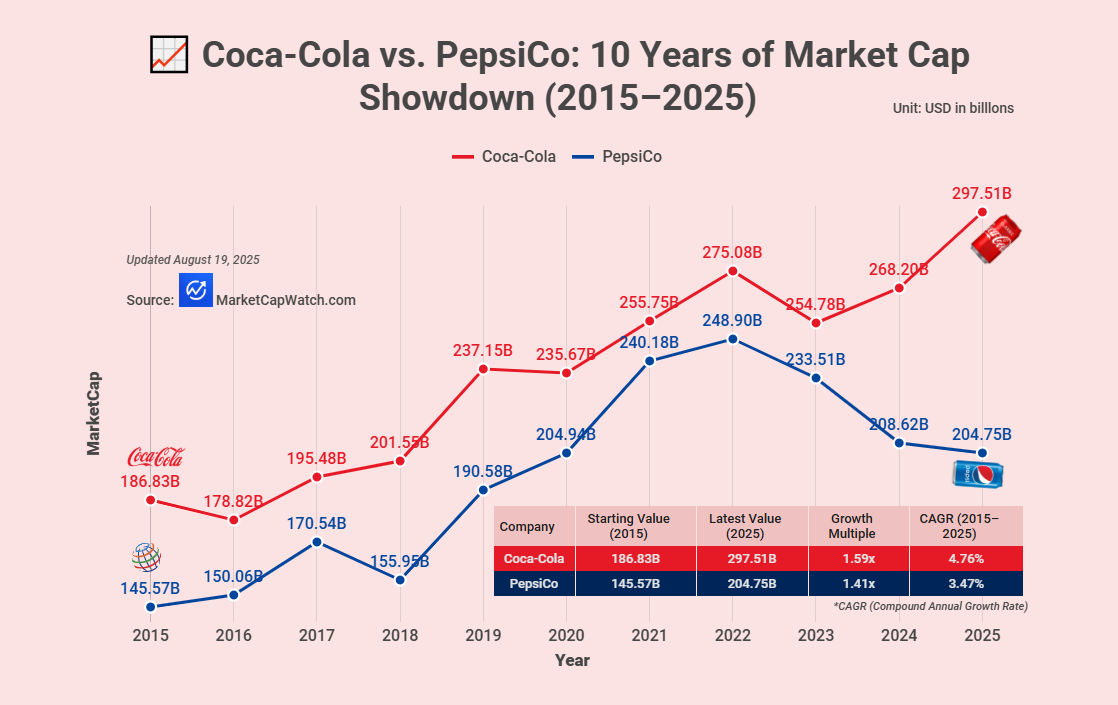
Source: MarketCapWatch - A website that ranks all listed companies worldwide
Tools: Infogram, MS Excel
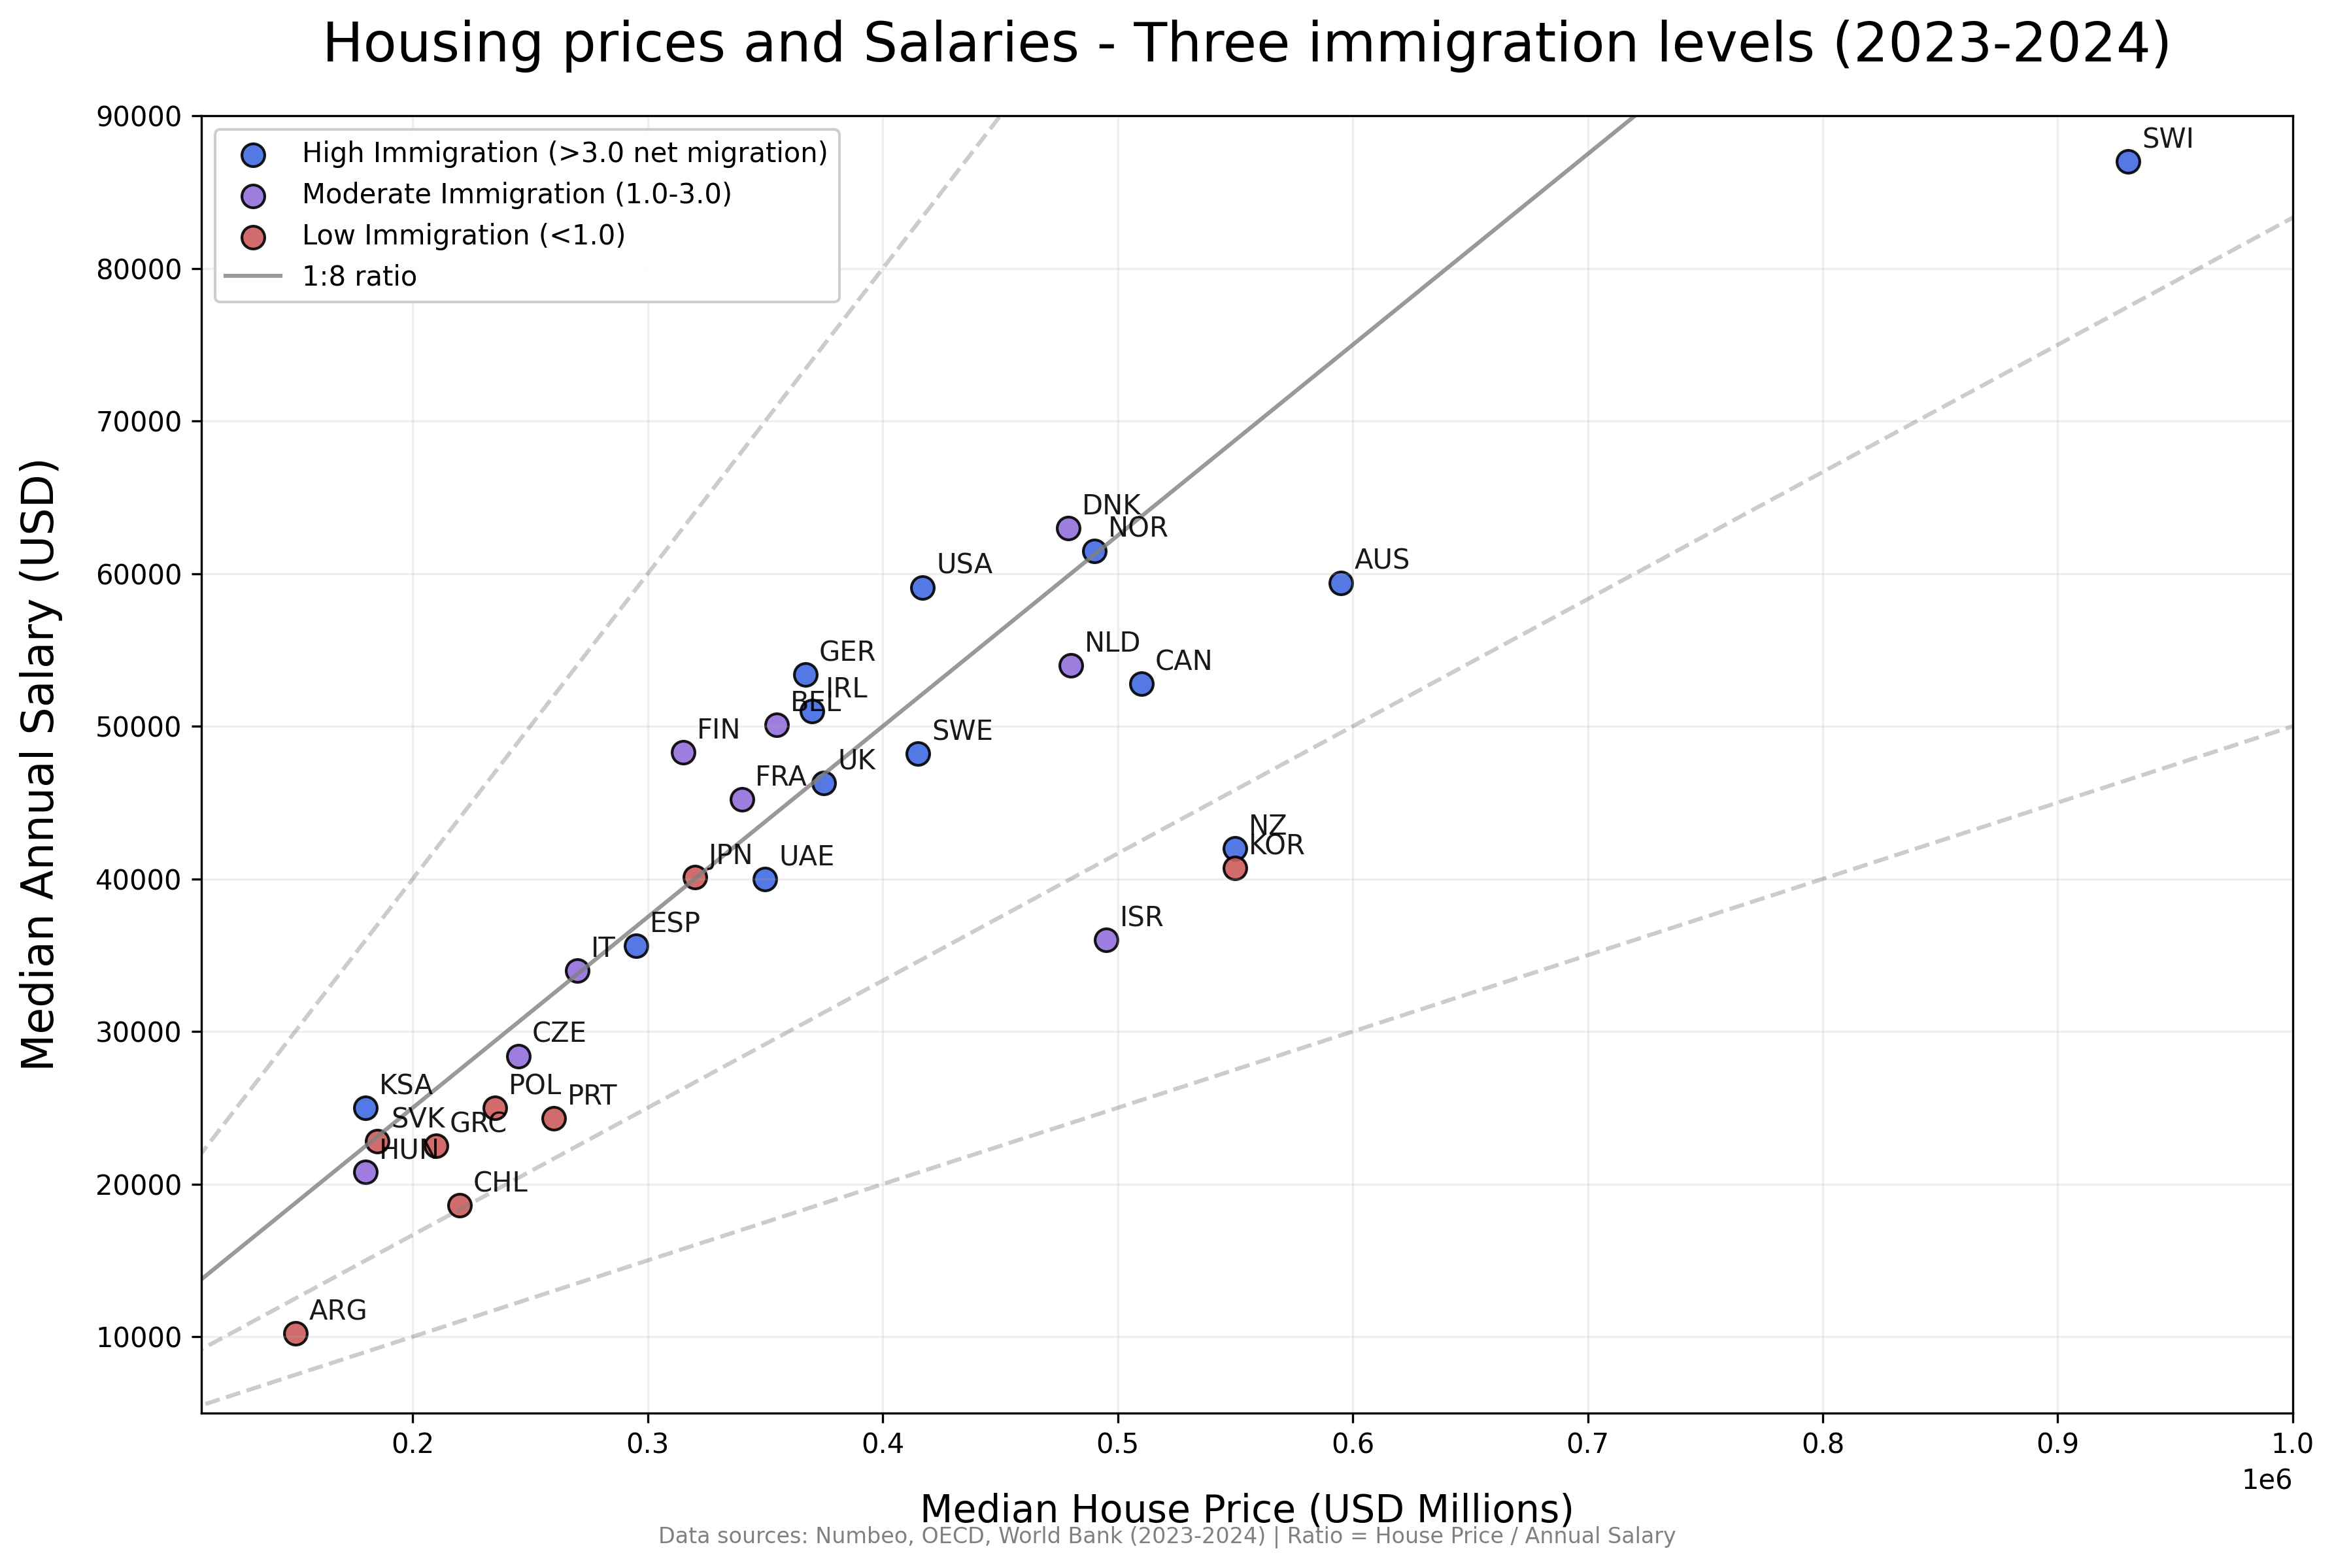
r/dataisbeautiful • u/Rauram99 • 2d ago
Notes:
I only included countries with >0.830 HDI >5 Millions population.
Net migration rates are a cumulative average for the last 5-10 years.
r/dataisbeautiful • u/willkoeppen • 2d ago
This animation shows water levels on the upper Guadalupe River from midnight July 4, 2025, to 6 p.m. July 5 (local time). The flood killed 119 people in Kerr County, including 25 girls and two teenage counselors at Camp Mystic.
Data sources
Tools:
Interactive version with contextual information: https://www.willkoeppen.com/datavis/guadalupe-floods/
r/dataisbeautiful • u/Rauram99 • 5d ago
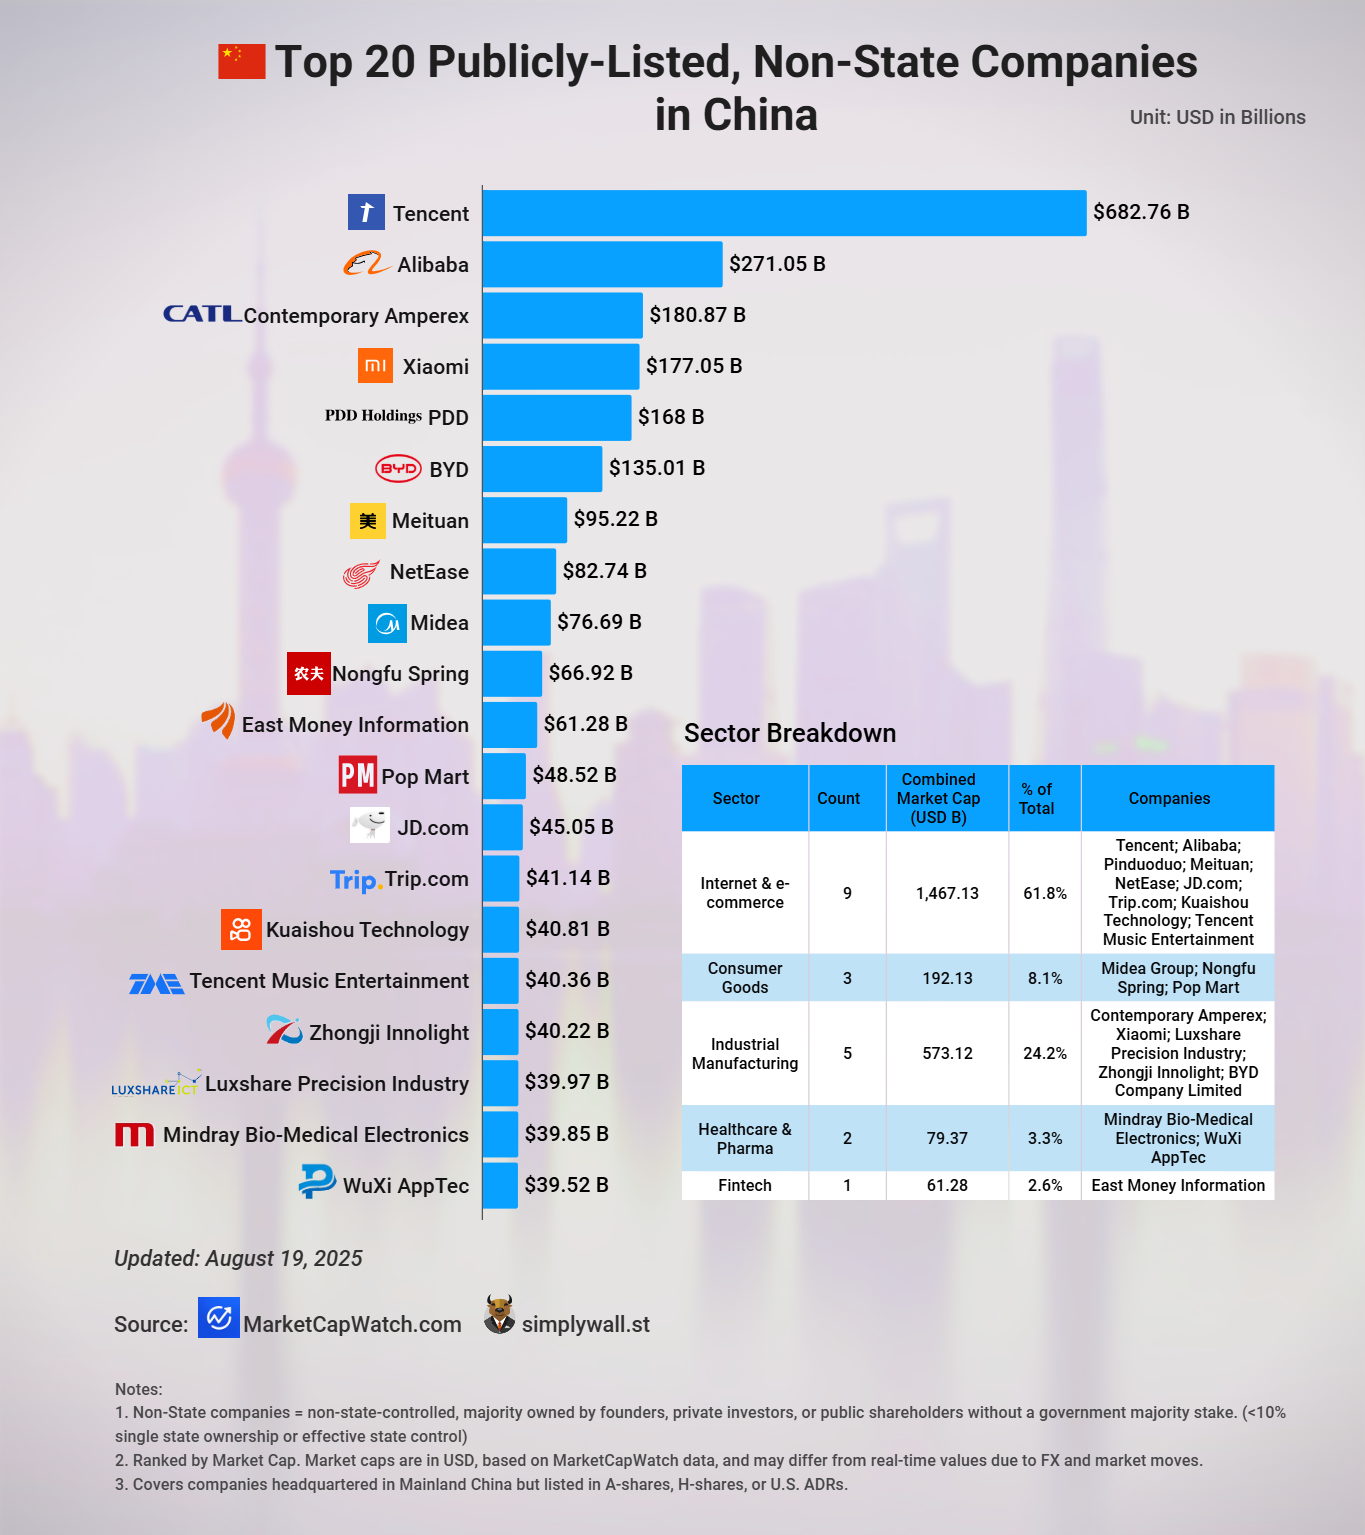
r/dataisbeautiful • u/Proud-Discipline9902 • 4d ago
Source: MarketCapWatch, Simply Wall St
Tools: Infogram, MS Excel
r/dataisbeautiful • u/FluidModeNetwork • 19h ago
My sheets document includes the sources, but the ranking uses 13 different sources. Sadly, not every country is included in every source so you will see blank spaces for countries that are left out in the data. I've also created a correlation index to see how different metrics matched up with each other and you can see the data I used for each ranking.
https://docs.google.com/spreadsheets/d/1YbfVevxEthNgDtK69P48Xm39bXLHi8eqfeFwxTTYEJE/edit?usp=sharing
Hope you like it, lemme know if you have any questions.
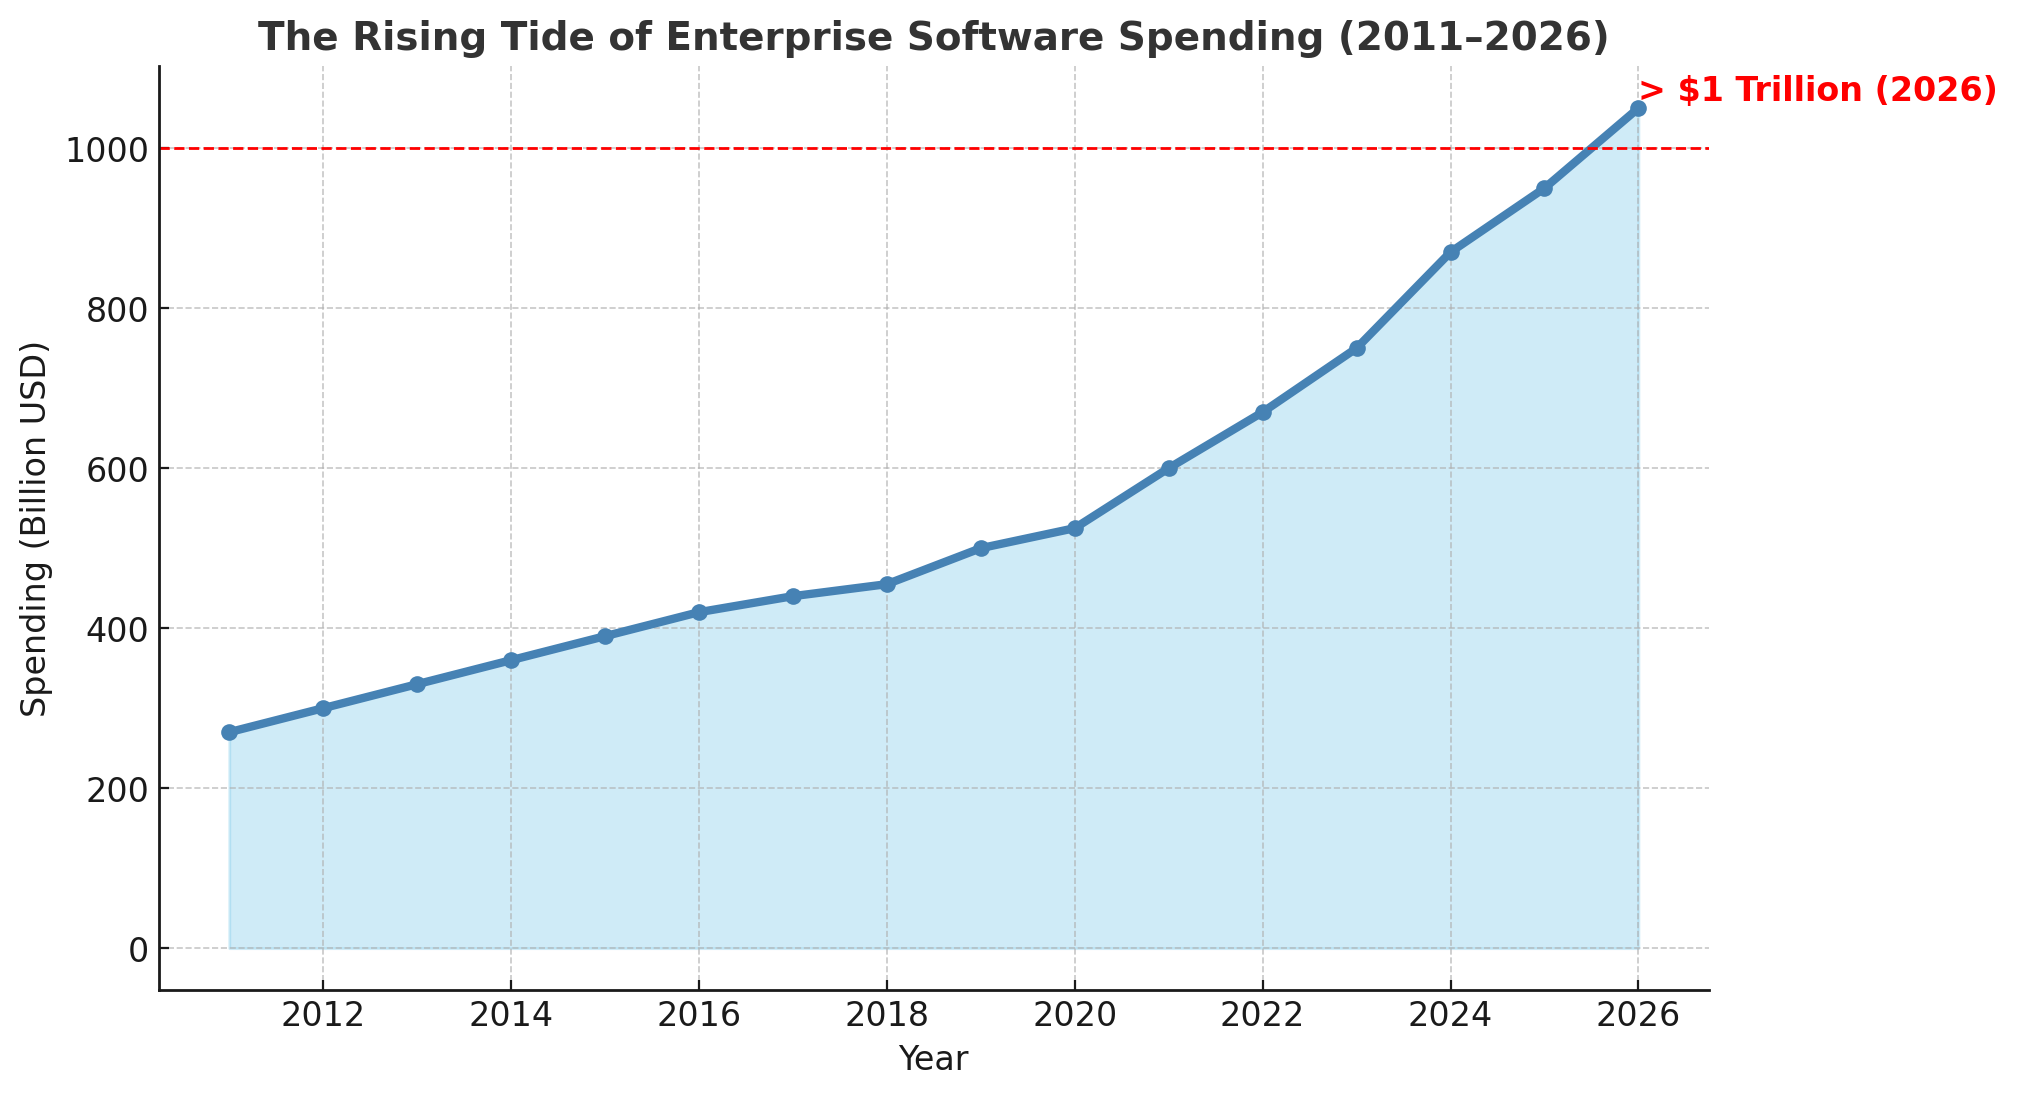
r/dataisbeautiful • u/XsLiveInTexas • 5d ago
In 2011, the popular VC firm Andreessen Horowitz said "Software will eat the world" which is still their tagline.
In a recent email by Cubbie, a company which ranks the top software products, showed breakdown of spend by different software categories.
So, I put together a historical chart showing the rise of software, shown through the lens of how much companies are actually spending on it globally. I factored in the likely spend given the rise of workforce increases next year and the ongoing shift toward AI tools, which are obviously accelerating software adoption.
Tools used: Python / Matplotlib