r/dataisbeautiful • u/big_hole_energy • 5d ago
Interactive Double Pendulum Playground
14
Upvotes
r/dataisbeautiful • u/big_hole_energy • 5d ago
r/dataisbeautiful • u/HCMXero • 5d ago
This is my third post analyzing representational alignment between voter preferences and House delegations. After receiving valuable feedback on my previous posts suggesting I use actual House votes instead of presidential votes as a proxy for partisan preferences, I've completely revised the methodology.
This analysis now uses the actual popular vote totals from 2024 House elections in each state, providing a more precise measure of how voters specifically chose their congressional representatives. The data includes only votes for the two major parties (Republican and Democratic), excluding independents, third parties, and write-ins.
The improved methodology addresses concerns about ticket-splitting and gives us a clearer picture of representational gaps. Some states show dramatically different alignment scores compared to the presidential-based analysis, revealing where voters made different choices for President versus Congress.
r/dataisbeautiful • u/WargFlow • 6d ago
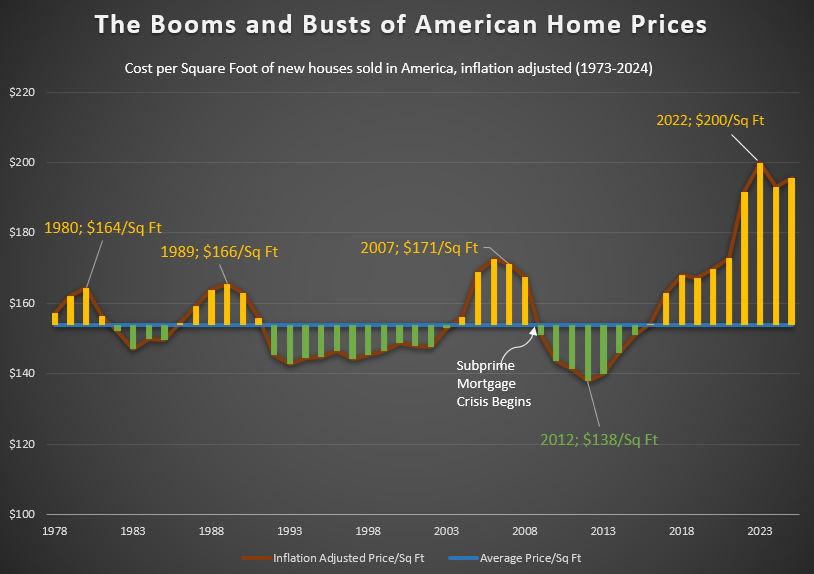
6 Years ago, I posted a graphic about American home prices: https://www.reddit.com/r/dataisbeautiful/comments/dxgshs/the_booms_and_busts_of_american_home_prices_oc/
I have received many requests to refresh the data. Now that the Census data has been released for 2024, I am updating with newly provided information. Values are adjusted for 2024 inflation adjusted dollars. For some reason, I used 2010 inflation adjusted dollars in my last visualization.
Source: https://www.census.gov/construction/chars/current.html
Tools: Excel
r/dataisbeautiful • u/Proud-Discipline9902 • 6d ago
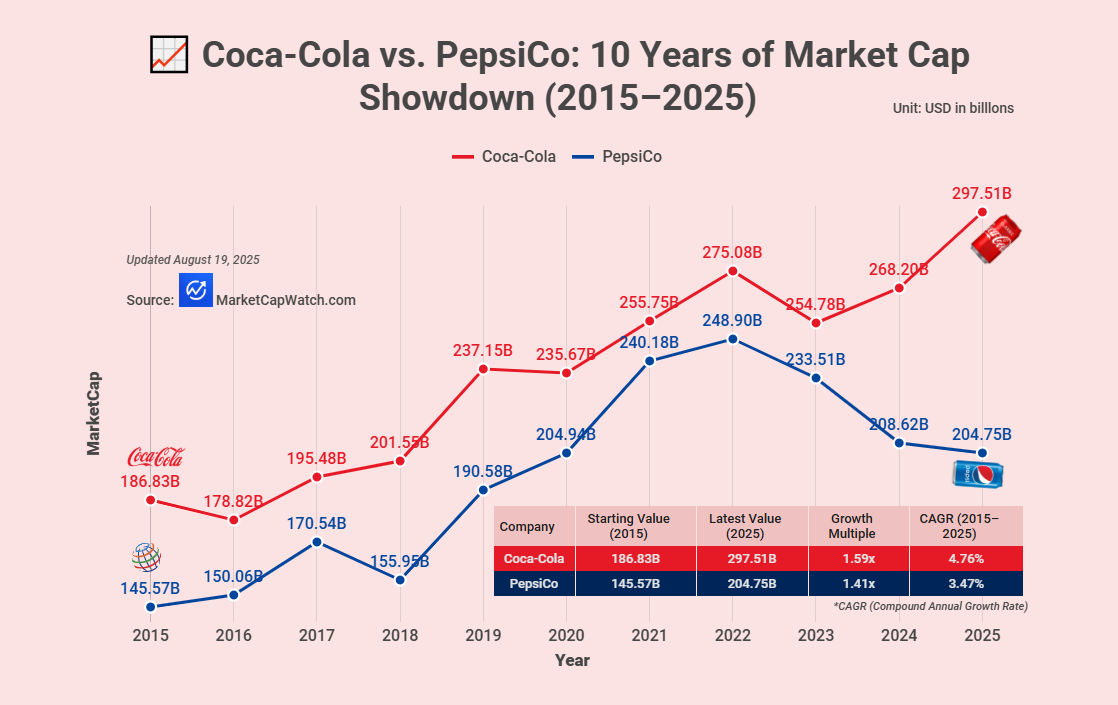
Source: MarketCapWatch - A website that ranks all listed companies worldwide
Tools: Infogram, MS Excel
r/dataisbeautiful • u/mapstream1 • 5d ago
r/dataisbeautiful • u/playfulsystems • 6d ago
Over the past few years I’ve been working on a game about copying famous paintings as quickly and as accurately possible with a mouse. While showing prototypes at exhibitions, I saved PNGs of the "forgeries" produced.
I realized that taking the average of the forgeries made of a given painting could be cool—similar to Jason Salavon’s aggregated portraits (whose work I love). I love the ghostly/historical feel of these types of images.
I've also posted an image that includes miniatures of the 256 Mona Lisa forgeries averaged in order of accuracy (i.e., highest scoring at the top left, lowest in the bottom-right). I’ve just started saving brush stroke data too, so I can make time-lapse replays of paintings being made.
I’d love feedback on two things:
Other visualization ideas I should try? I did a sliding-window average that turned out very cool. Aggregating stroke data?
Other types of data I should capture for future data viz or studies? I'd need to implement it soon since it's release is coming in the next few months.
Thanks in advance!
I can share a link to the game in the comments for those curious / if it helps with feedback.
r/dataisbeautiful • u/agprime19 • 6d ago
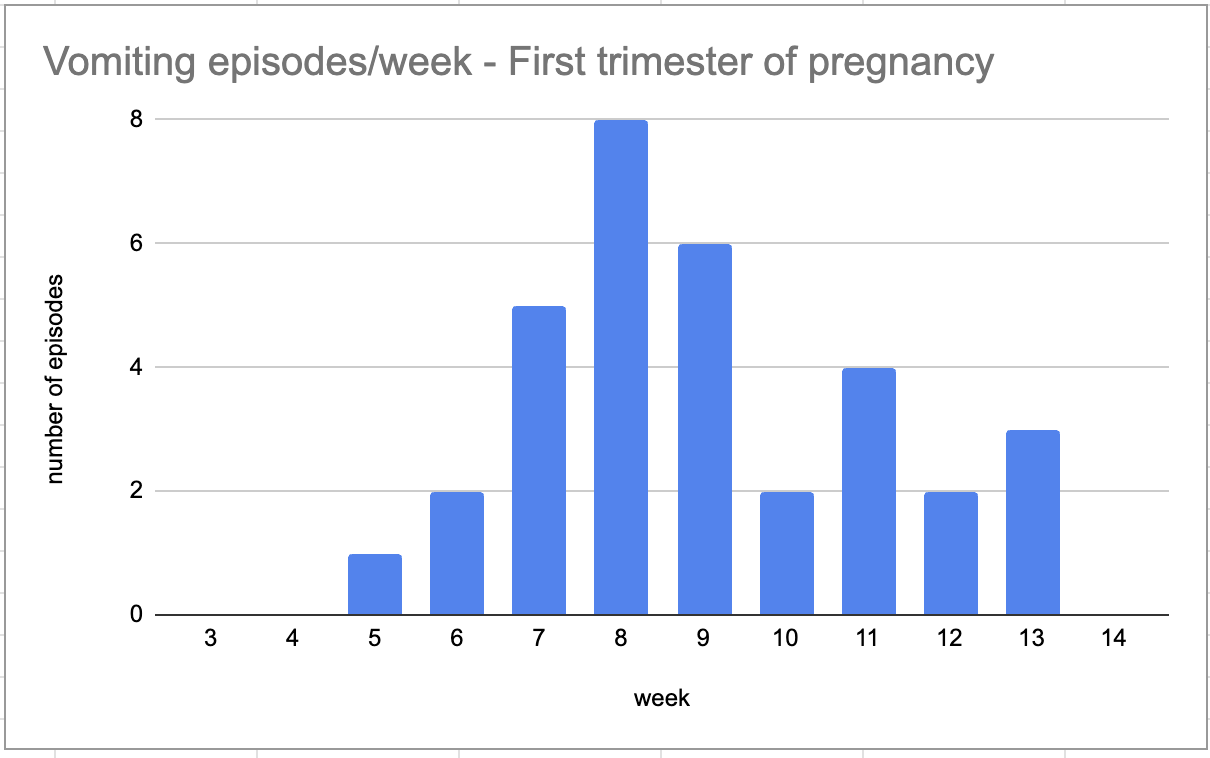
During my last pregnancy, I was even sicker but never took the data -- this time, I decided to record. FWIW, there was another vomiting episode in week 18-19, but I'm limiting this to first tri only.
r/dataisbeautiful • u/Lehepeal • 6d ago
r/dataisbeautiful • u/Sarquin • 6d ago
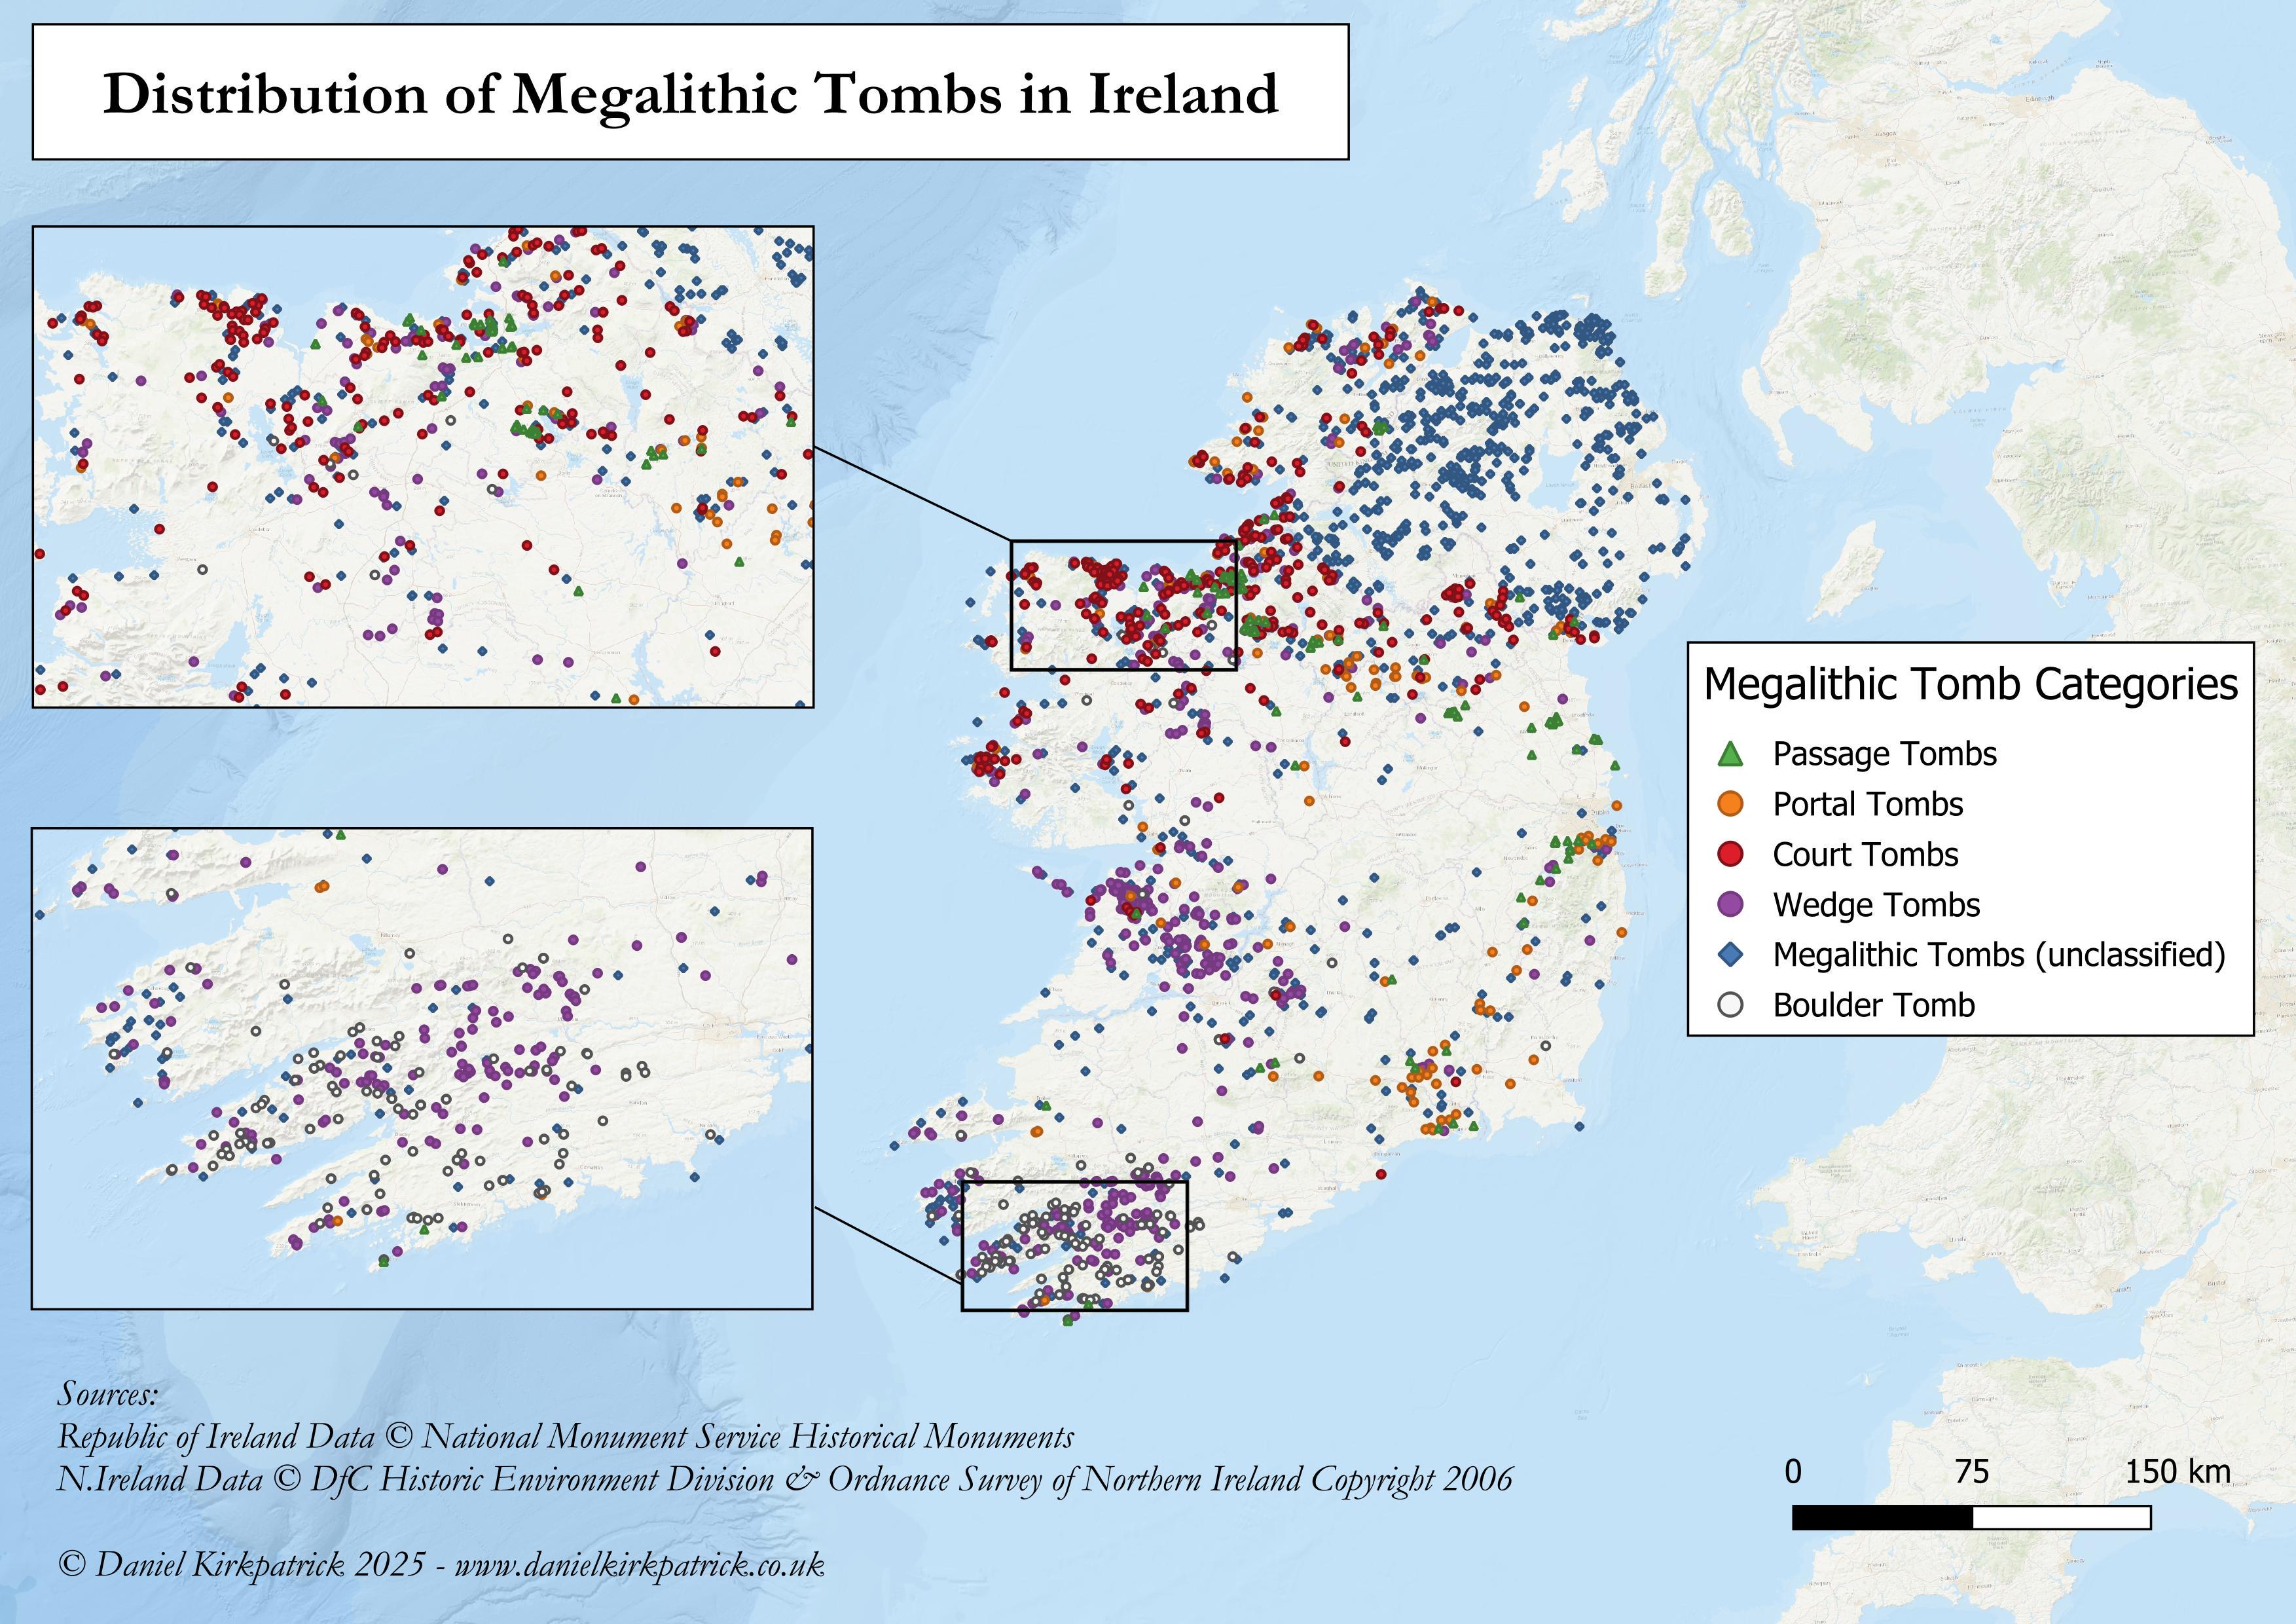
I know I'm not alone in my love for Ireland's ancient megalithic tombs and sites, so I have mapped all recorded sites across the whole of Ireland. Data for Northern Ireland doesn't provide categories, but you can see the overall distribution. For the Republic, I've included the breakdowns provided by the NMS.
The map combines historical monument data from the National Monument Service (NMS) of Ireland with the Department for Communities historical monument data. I cleaned the data sources up with some basic transformation in PowerQuery and then used QGIS to visualise (I'm slowly learning how to do this!).
There's obviously a few trends you can see from the data, particularly the concentrations of Wedge and Boulder Tombs in the south west. I'm sure you can spot many more that I wouldn't notice too.
I previously mapped Ogham Stones and Stone Circles.
Any thoughts about the map or data insights would be very welcome.
r/dataisbeautiful • u/iseedatapoints • 5d ago
Hey everyone,
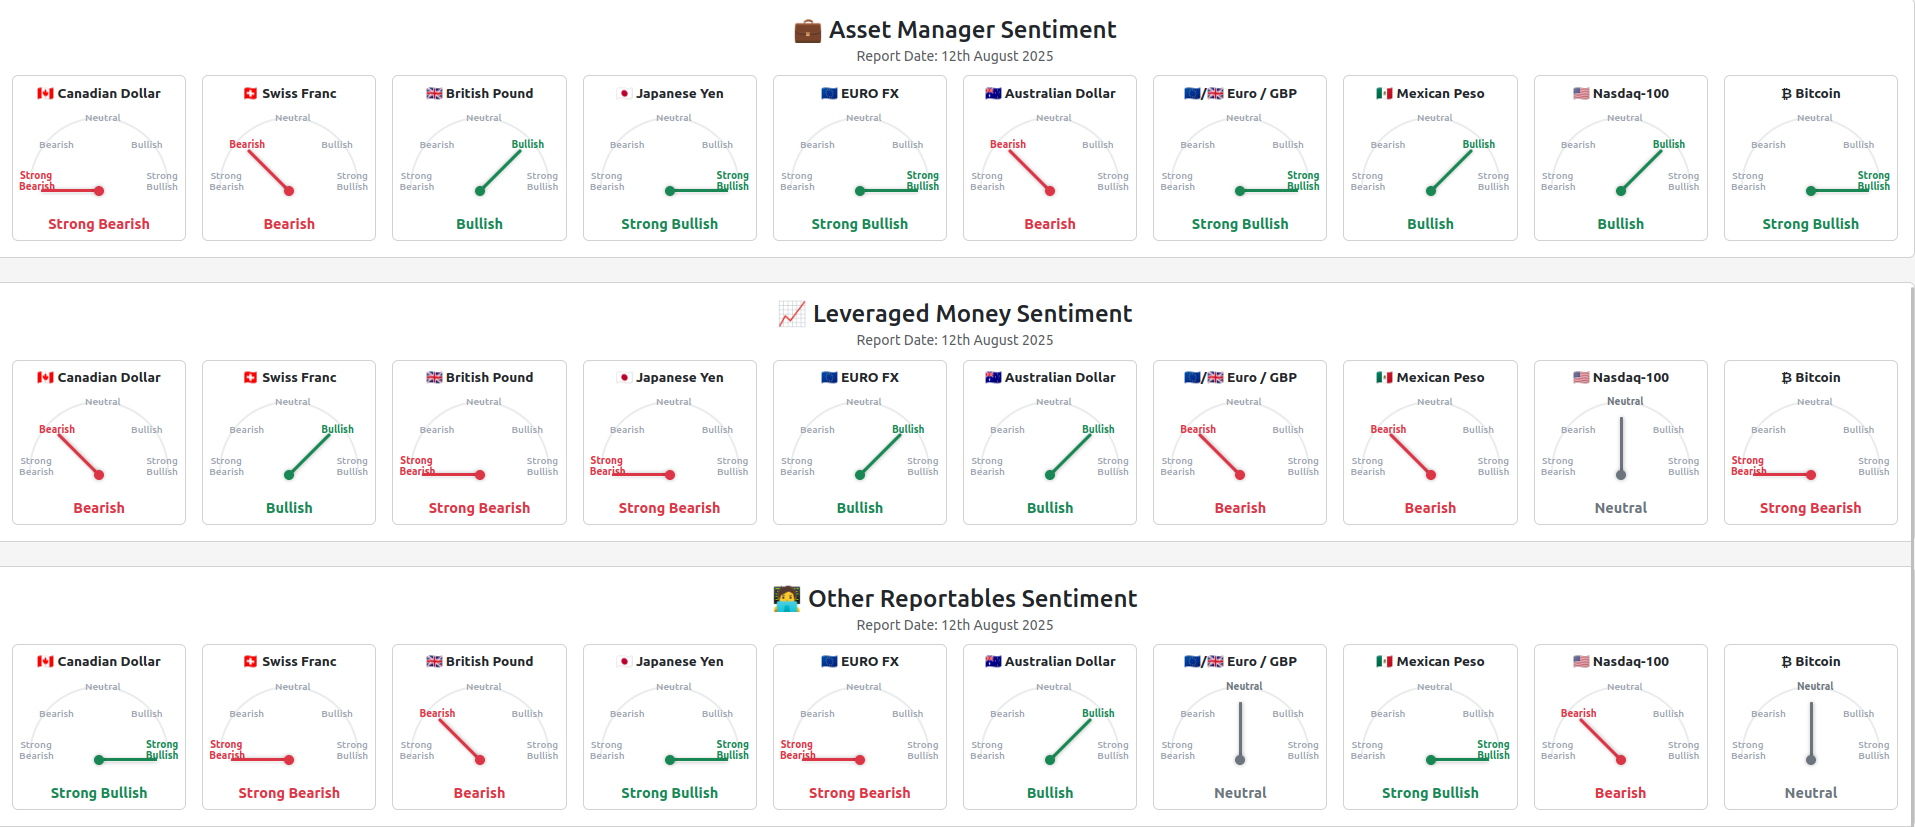
I’ve been working on a free sentiment analysis tool that visualizes the CFTC Commitment of Traders (CoT) report as an easy-to-read speedometer gauge.
Here’s the latest snapshot for 12th August 2025:
📊 Breakdown by Group
This visualization makes it much easier to spot where big money is positioned compared to retail noise.
💡 I built this in less than a week on Rails with Chart.js. Free to check out here: [https://easycftc.com]()
r/dataisbeautiful • u/Fun-Pace-4636 • 5d ago
r/dataisbeautiful • u/news-10 • 5d ago
r/dataisbeautiful • u/SidewalkMD • 6d ago
r/dataisbeautiful • u/ANTrixSTAR • 6d ago
r/dataisbeautiful • u/Best-and-Blurst • 7d ago
Phone GPS data from my last cycling trip, which was aborted after an unanticipated encounter with a physical object of roadway non-conformance, resulting in aerial excursion and rapid uncontrolled deceleration.
Hit a rock in the middle of the cycle lane and fell off my bike.
The phone was in my pocket at the time, so all motion tracks me and not the bike. Since after a certain point in the journey we parted company.
I also did not see the rock at all, so there was no braking or loss of speed before impact. In fact, I was still getting faster due to clearing the brow of the hill. Speed would have topped out at 45kph if I'd encountered the rock any further downhill.
Dislocated shoulder with a small fracture and plenty of road rash. Wear a helmet, because I did and it definitely prevented much more serious injury.
r/dataisbeautiful • u/latinometrics • 6d ago
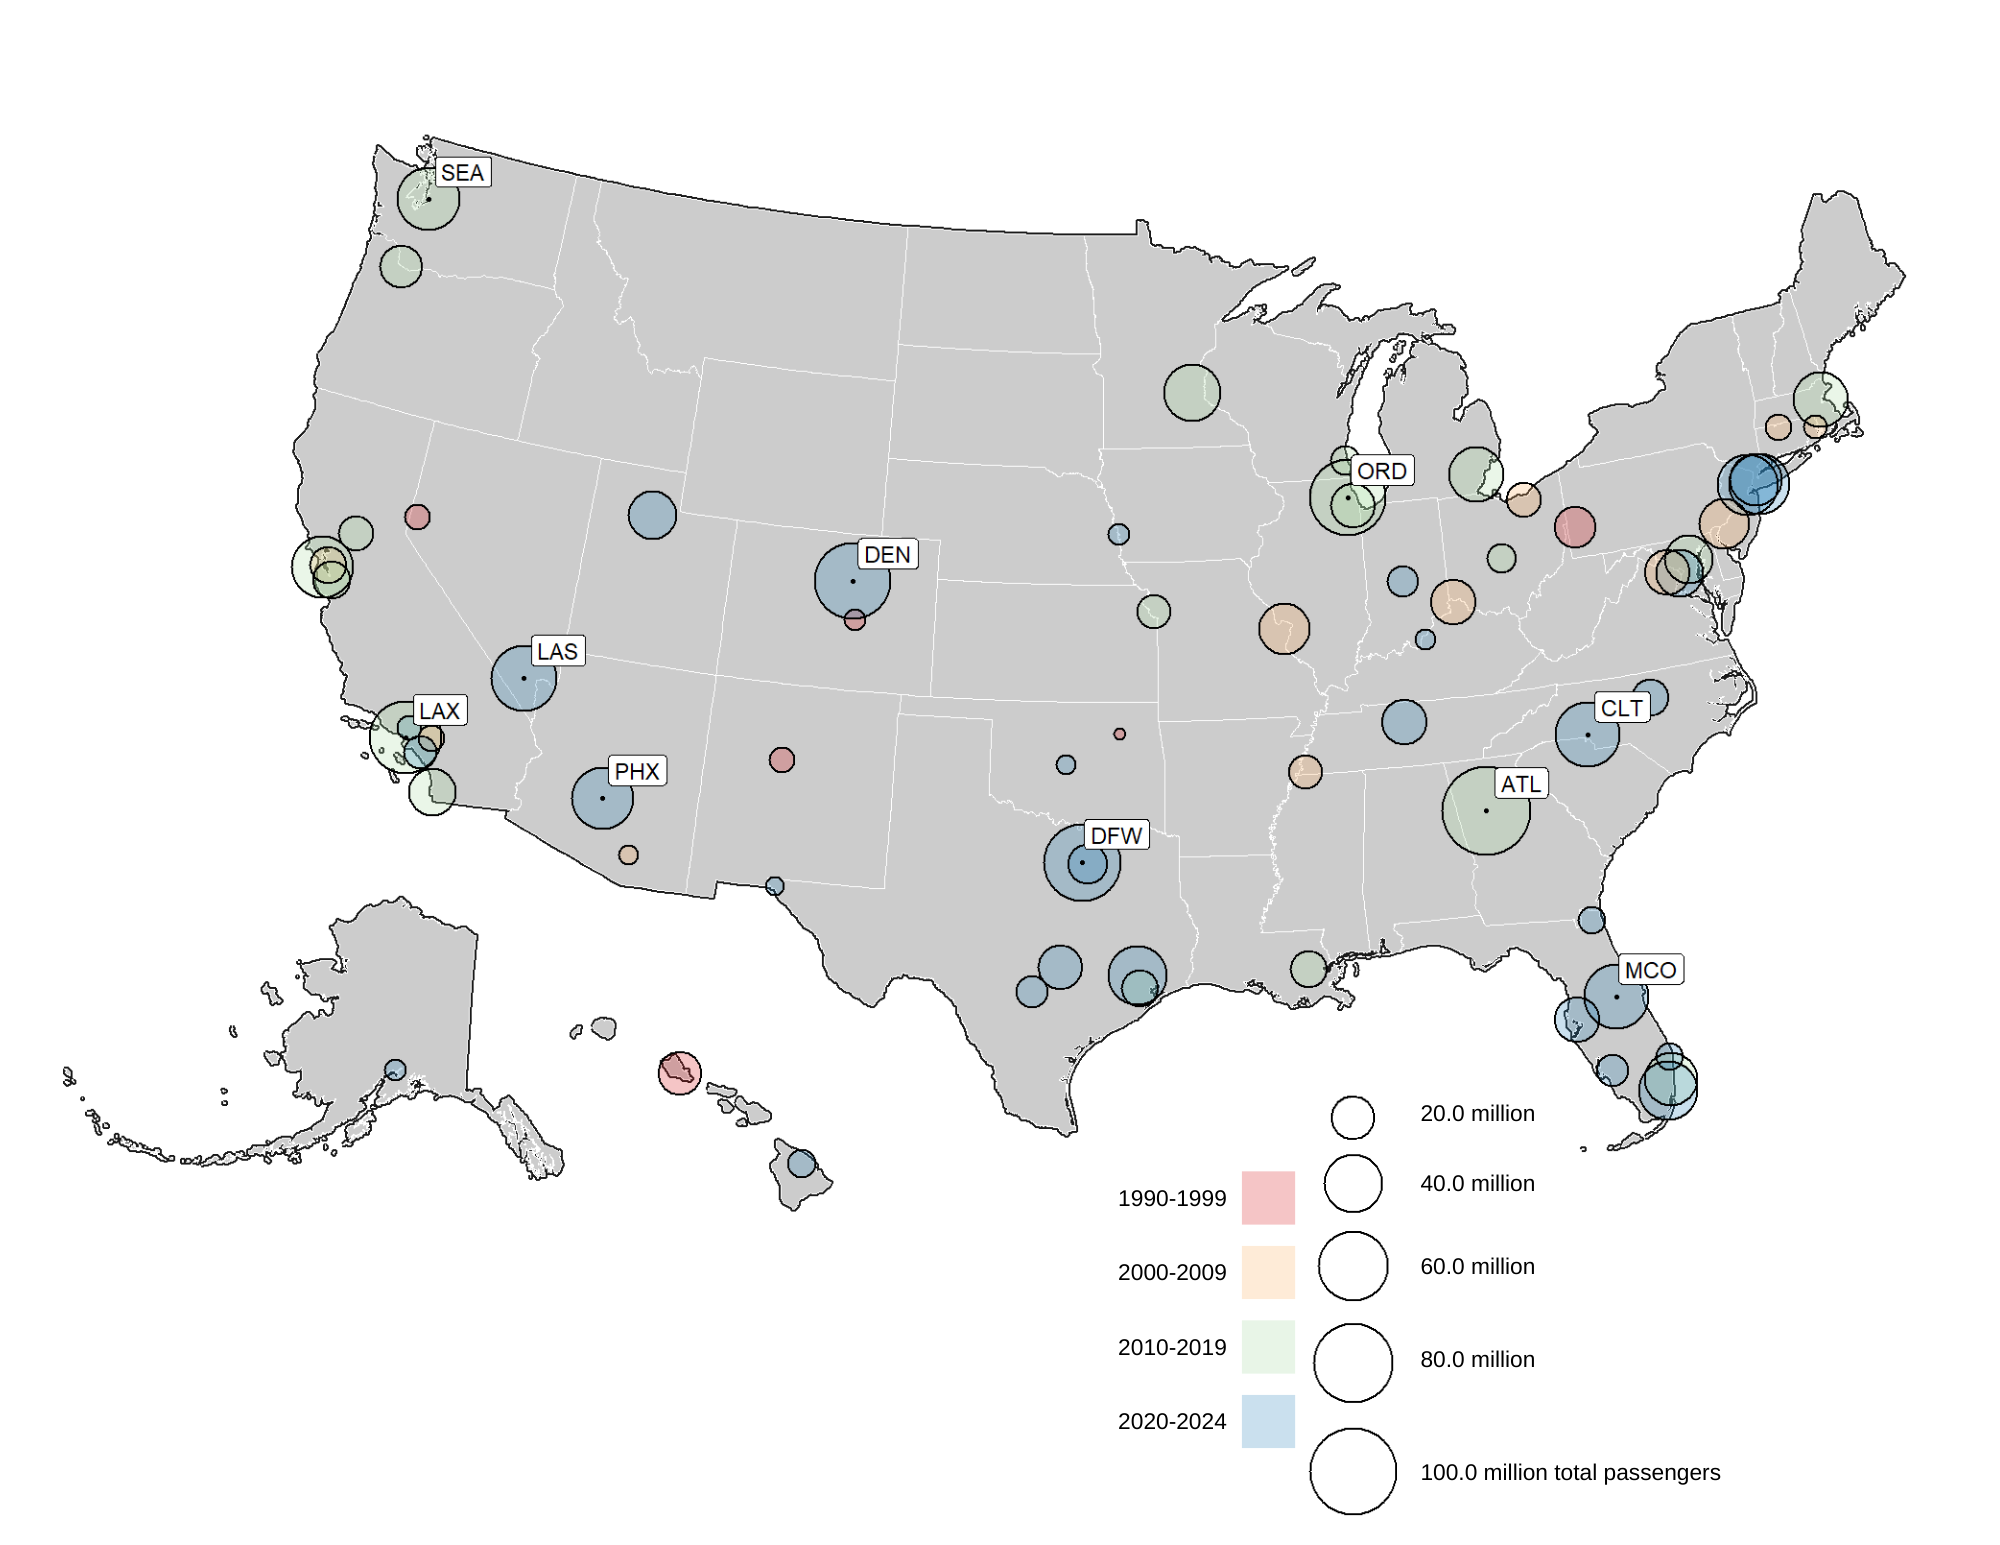
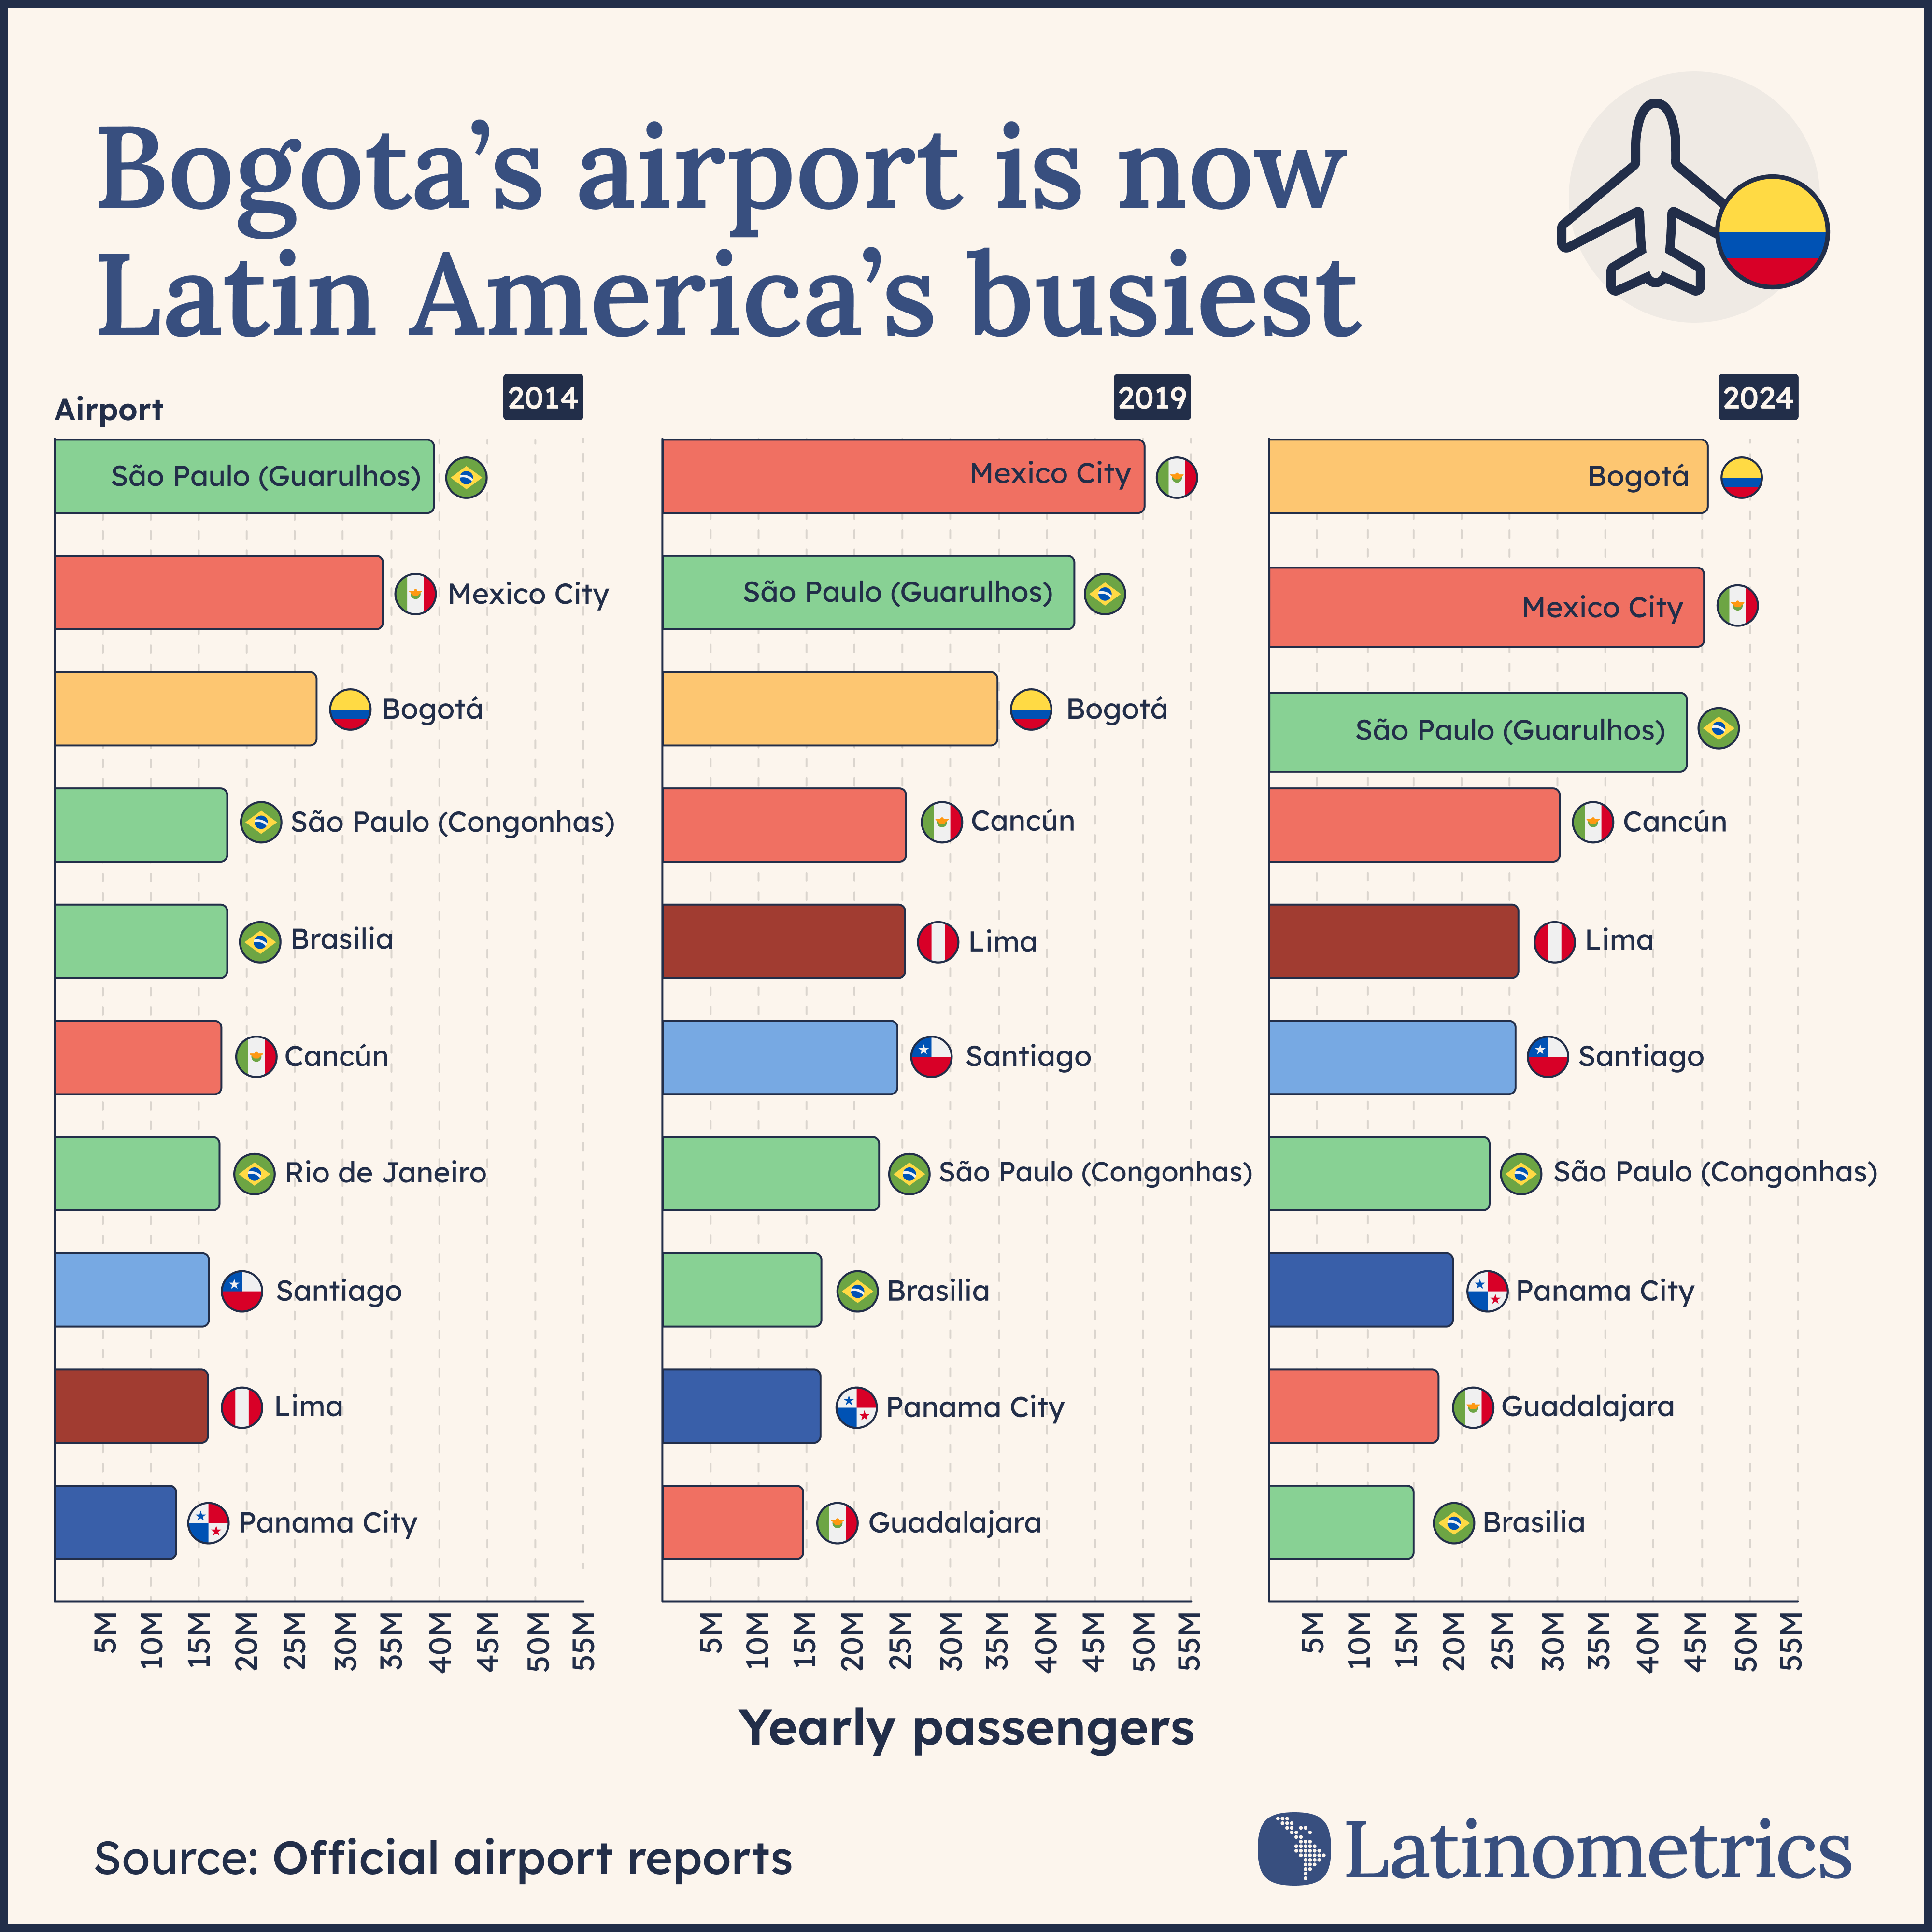
🛫 🇨🇴 Bogotá just dethroned São Paulo and Mexico City to become Latin America's busiest airport... here's what changed ↓
In Latin America, we increasingly catch flights, not feelings. 746M passengers flew Latin America & Caribbean routes last year, an +86M boost since 2019.
More of us caught flights through Bogota's El Dorado airport than any other airport in the region—marking a shift from the Brazilian and Mexican dominance of decades past.
No single terminal felt the surge more than Bogotá-El Dorado. The Colombian hub processed 45.4 million travelers, edging past Mexico City (44.9 M) and São Paulo-Guarulhos (43.1 M) to become the region's busiest airport for the first time. Geography helps: Bogotá sits midway between the Americas, so Avianca and LATAM have built spider-web networks that pull in connections to the US and Europe.
Tourism to Colombia has also recovered remarkably, with a 58% increase since pre-pandemic (2019) numbers.
Similar explanations can also account for the top-ten positions of both Lima and Panama City, which have become key points of transfer for inter-American flight paths. Panama and Lima, in part, replaced Mexico City's grand plans to connect the region after President López Obrador infamously canceled a new airport project during his first month in office back in 2018.
story continues... 💌
Tools: Figma, Rawgraphs
Source: List of the busiest airports in Latin America - Wikipedia
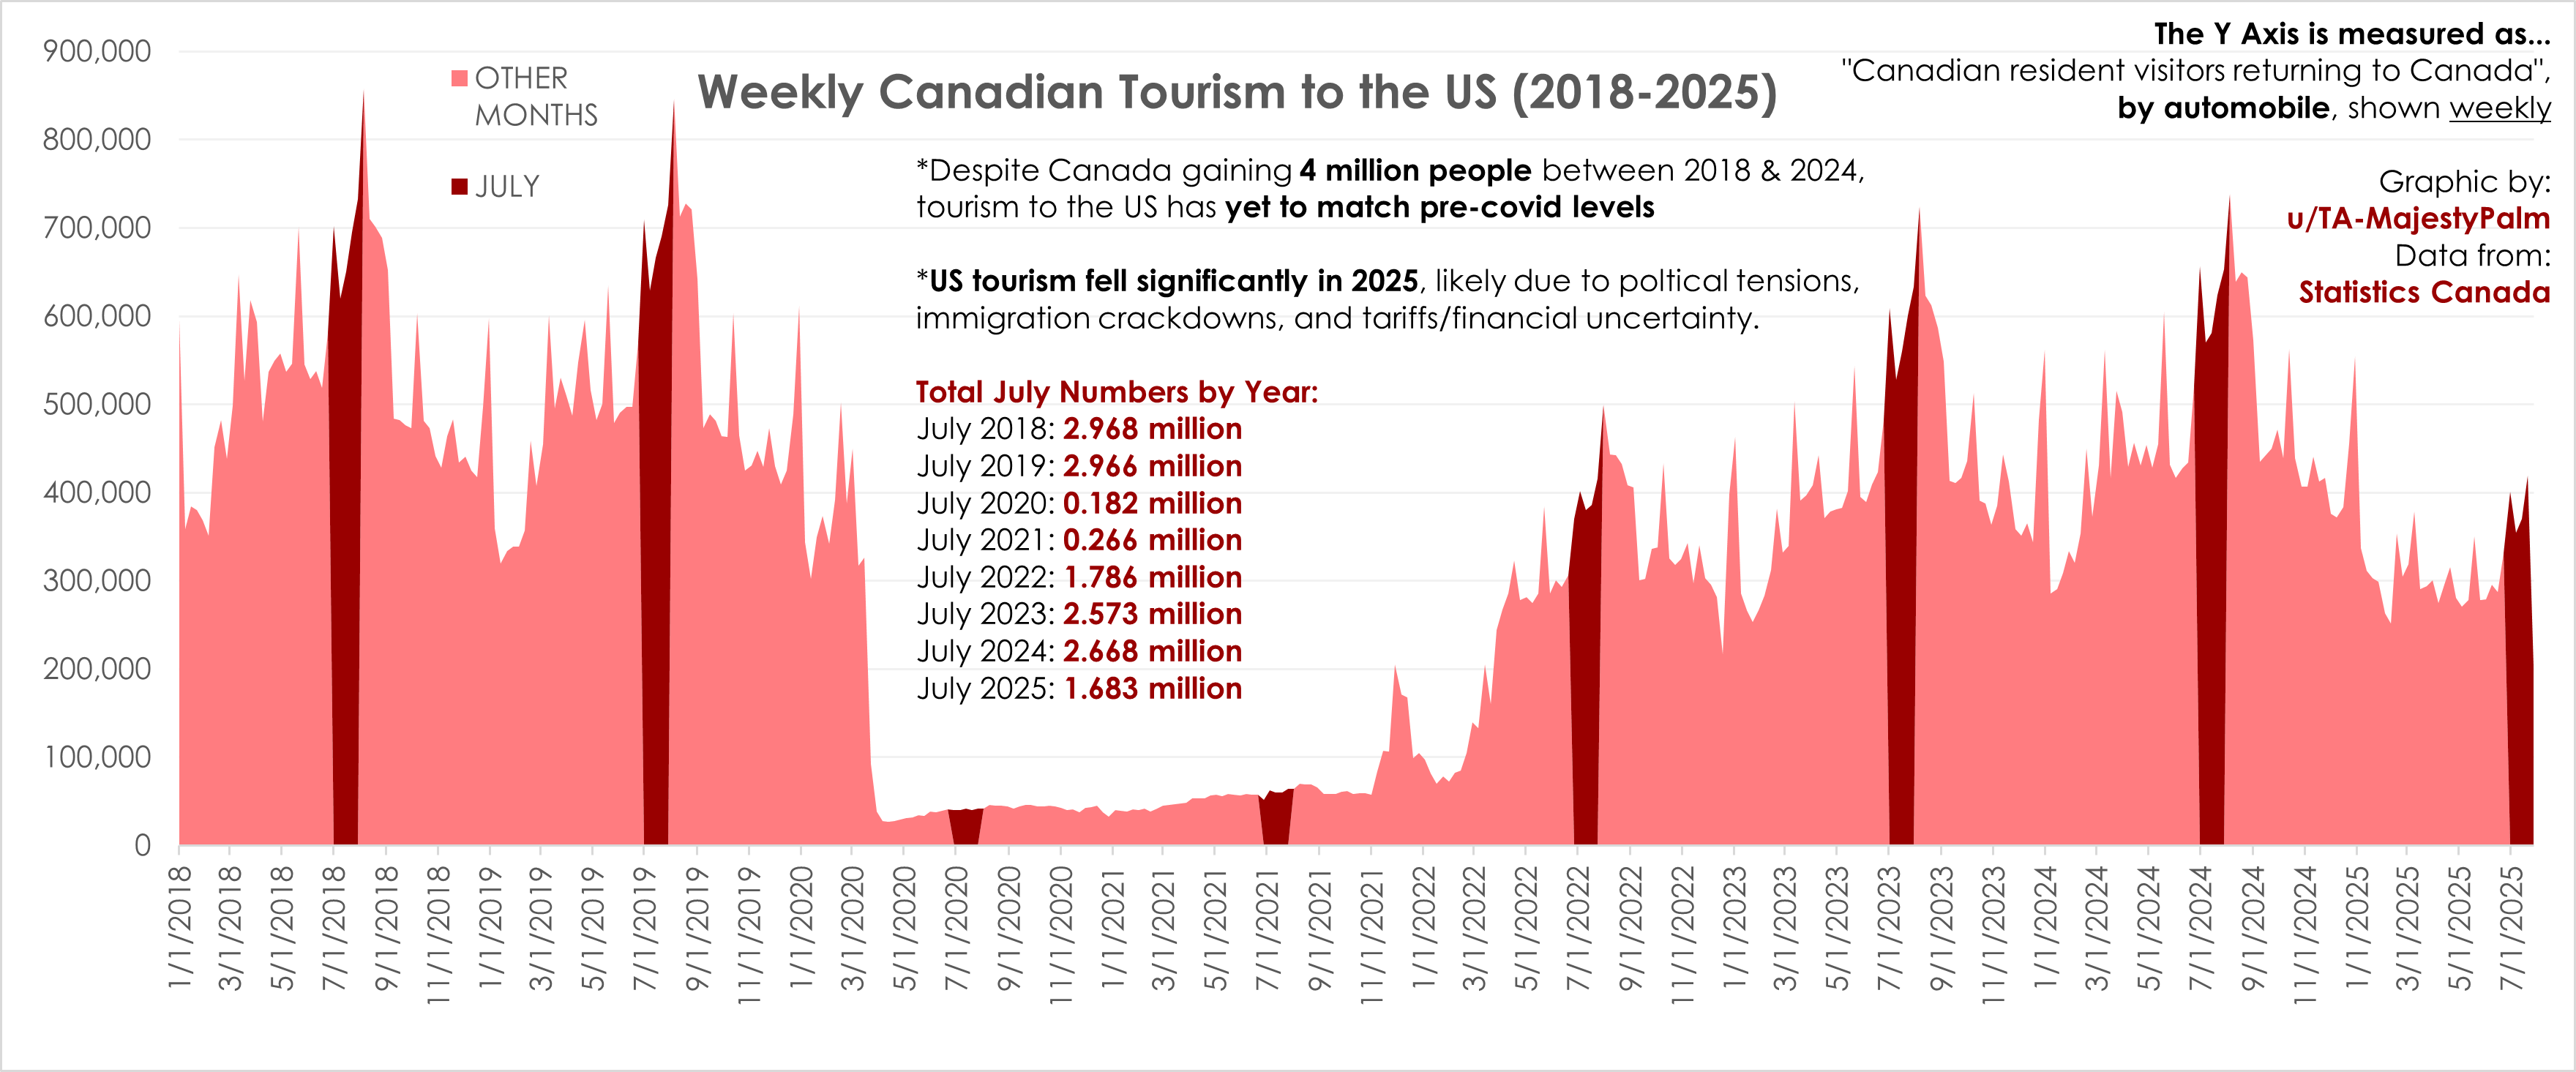
r/dataisbeautiful • u/TA-MajestyPalm • 7d ago
Graphic by me, created in Excel.
Source: https://www150.statcan.gc.ca/t1/tbl1/en/cv.action?pid=2410005701
As a trending news topic I wanted to investigate for myself how much Canadian Tourism to the US has recently declined, and how this compares historically.
The data source I used gives the daily number of Canadians returning from the US by car - I converted this to weekly totals as the daily graph had a lot of variance and was harder to read.
I highlighted every July for easier comparison.
r/dataisbeautiful • u/najumobi • 5d ago
r/dataisbeautiful • u/seshr-app • 7d ago
Hey guys, I wanted to see if there were any trends in the way people like to meet up and hangout in London, so I analyzed and labelled over 25,000 posts from r/LondonSocialClub to see what was up! If you don't know what this subreddit is, it's basically just a place you can promote and propose hangouts with other strangers.
Data Analysis:
Data from 2011-2024 was downloaded via a torrent for the subreddit (DM me for details) and the remaining data was scraped using the reddit API. The data was then chunked an labelled by chatgpt-4o-mini and chatgpt-4.1-mini. Each post selftext scanned, checked to see if it was an event hosting, and labelled based on what the engine thought was the primary theme/category of the event. I also went ahead and built a labeler that scraped whatever location and time the event was being held at.
Results:
Pretty interesting stuff. We can see that after COVID, 'Music' events really took off, overtaking 'Pub Nights' in 2024. I feel like this reflects a greater trend toward people spending less and less going out to drink these days. Generally speaking, though, pub nights are still really popular, with the majority of boroughs in London having it as their favorite social past time (at least for this subreddit).
Let me know your thoughts and if there's any way I could improve on this for next time!
r/dataisbeautiful • u/Proud-Discipline9902 • 7d ago
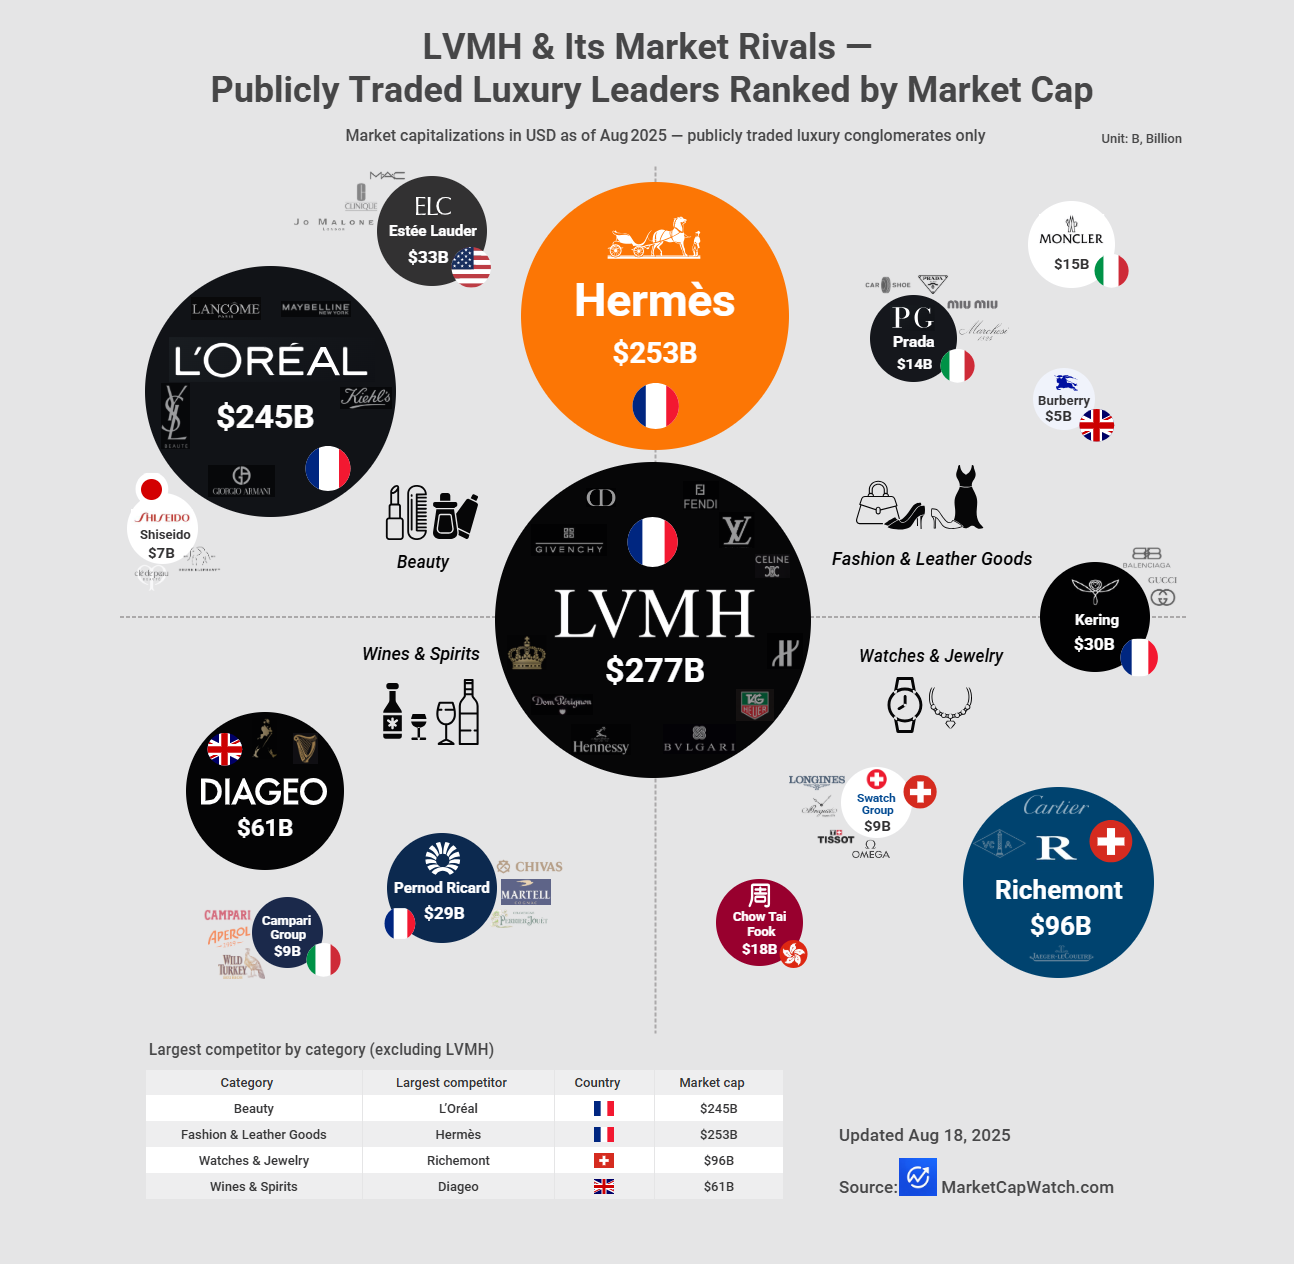
Data Source: All market capitalization figures are sourced from MarketCapWatch, which tracks and ranks publicly traded companies worldwide. Data reflects market values as of August 2025 and is presented in USD for consistency.
Methodology: We compiled a list of major luxury-focused companies that are publicly listed and meet our inclusion criteria (primary business in luxury goods or services, significant global presence). For each company, we recorded its latest market capitalization from MarketCapWatch and grouped them by headquarters country and product category.
Tools: Data collection and aggregation were performed in Microsoft Excel, with additional formatting and calculations for category and country shares. The final chart was created and polished using Infogram for presentation.
Definition & Inclusion Criteria: For this analysis, a luxury goods company is defined as a business whose primary revenue and brand identity come from products or services positioned in the high‑end, premium segment, typically characterised by:
Inclusion criteria:
Publicly traded on a recognised stock exchange (no private companies, even if globally famous, such as Chanel or Rolex)
Significant presence in one or more of LVMH’s core categories: 1. Fashion & Leather Goods
Why some well‑known luxury brands aren’t listed:
r/dataisbeautiful • u/LivingMNML • 5d ago
r/dataisbeautiful • u/Paleo614 • 5d ago
r/dataisbeautiful • u/sujan_sk • 5d ago
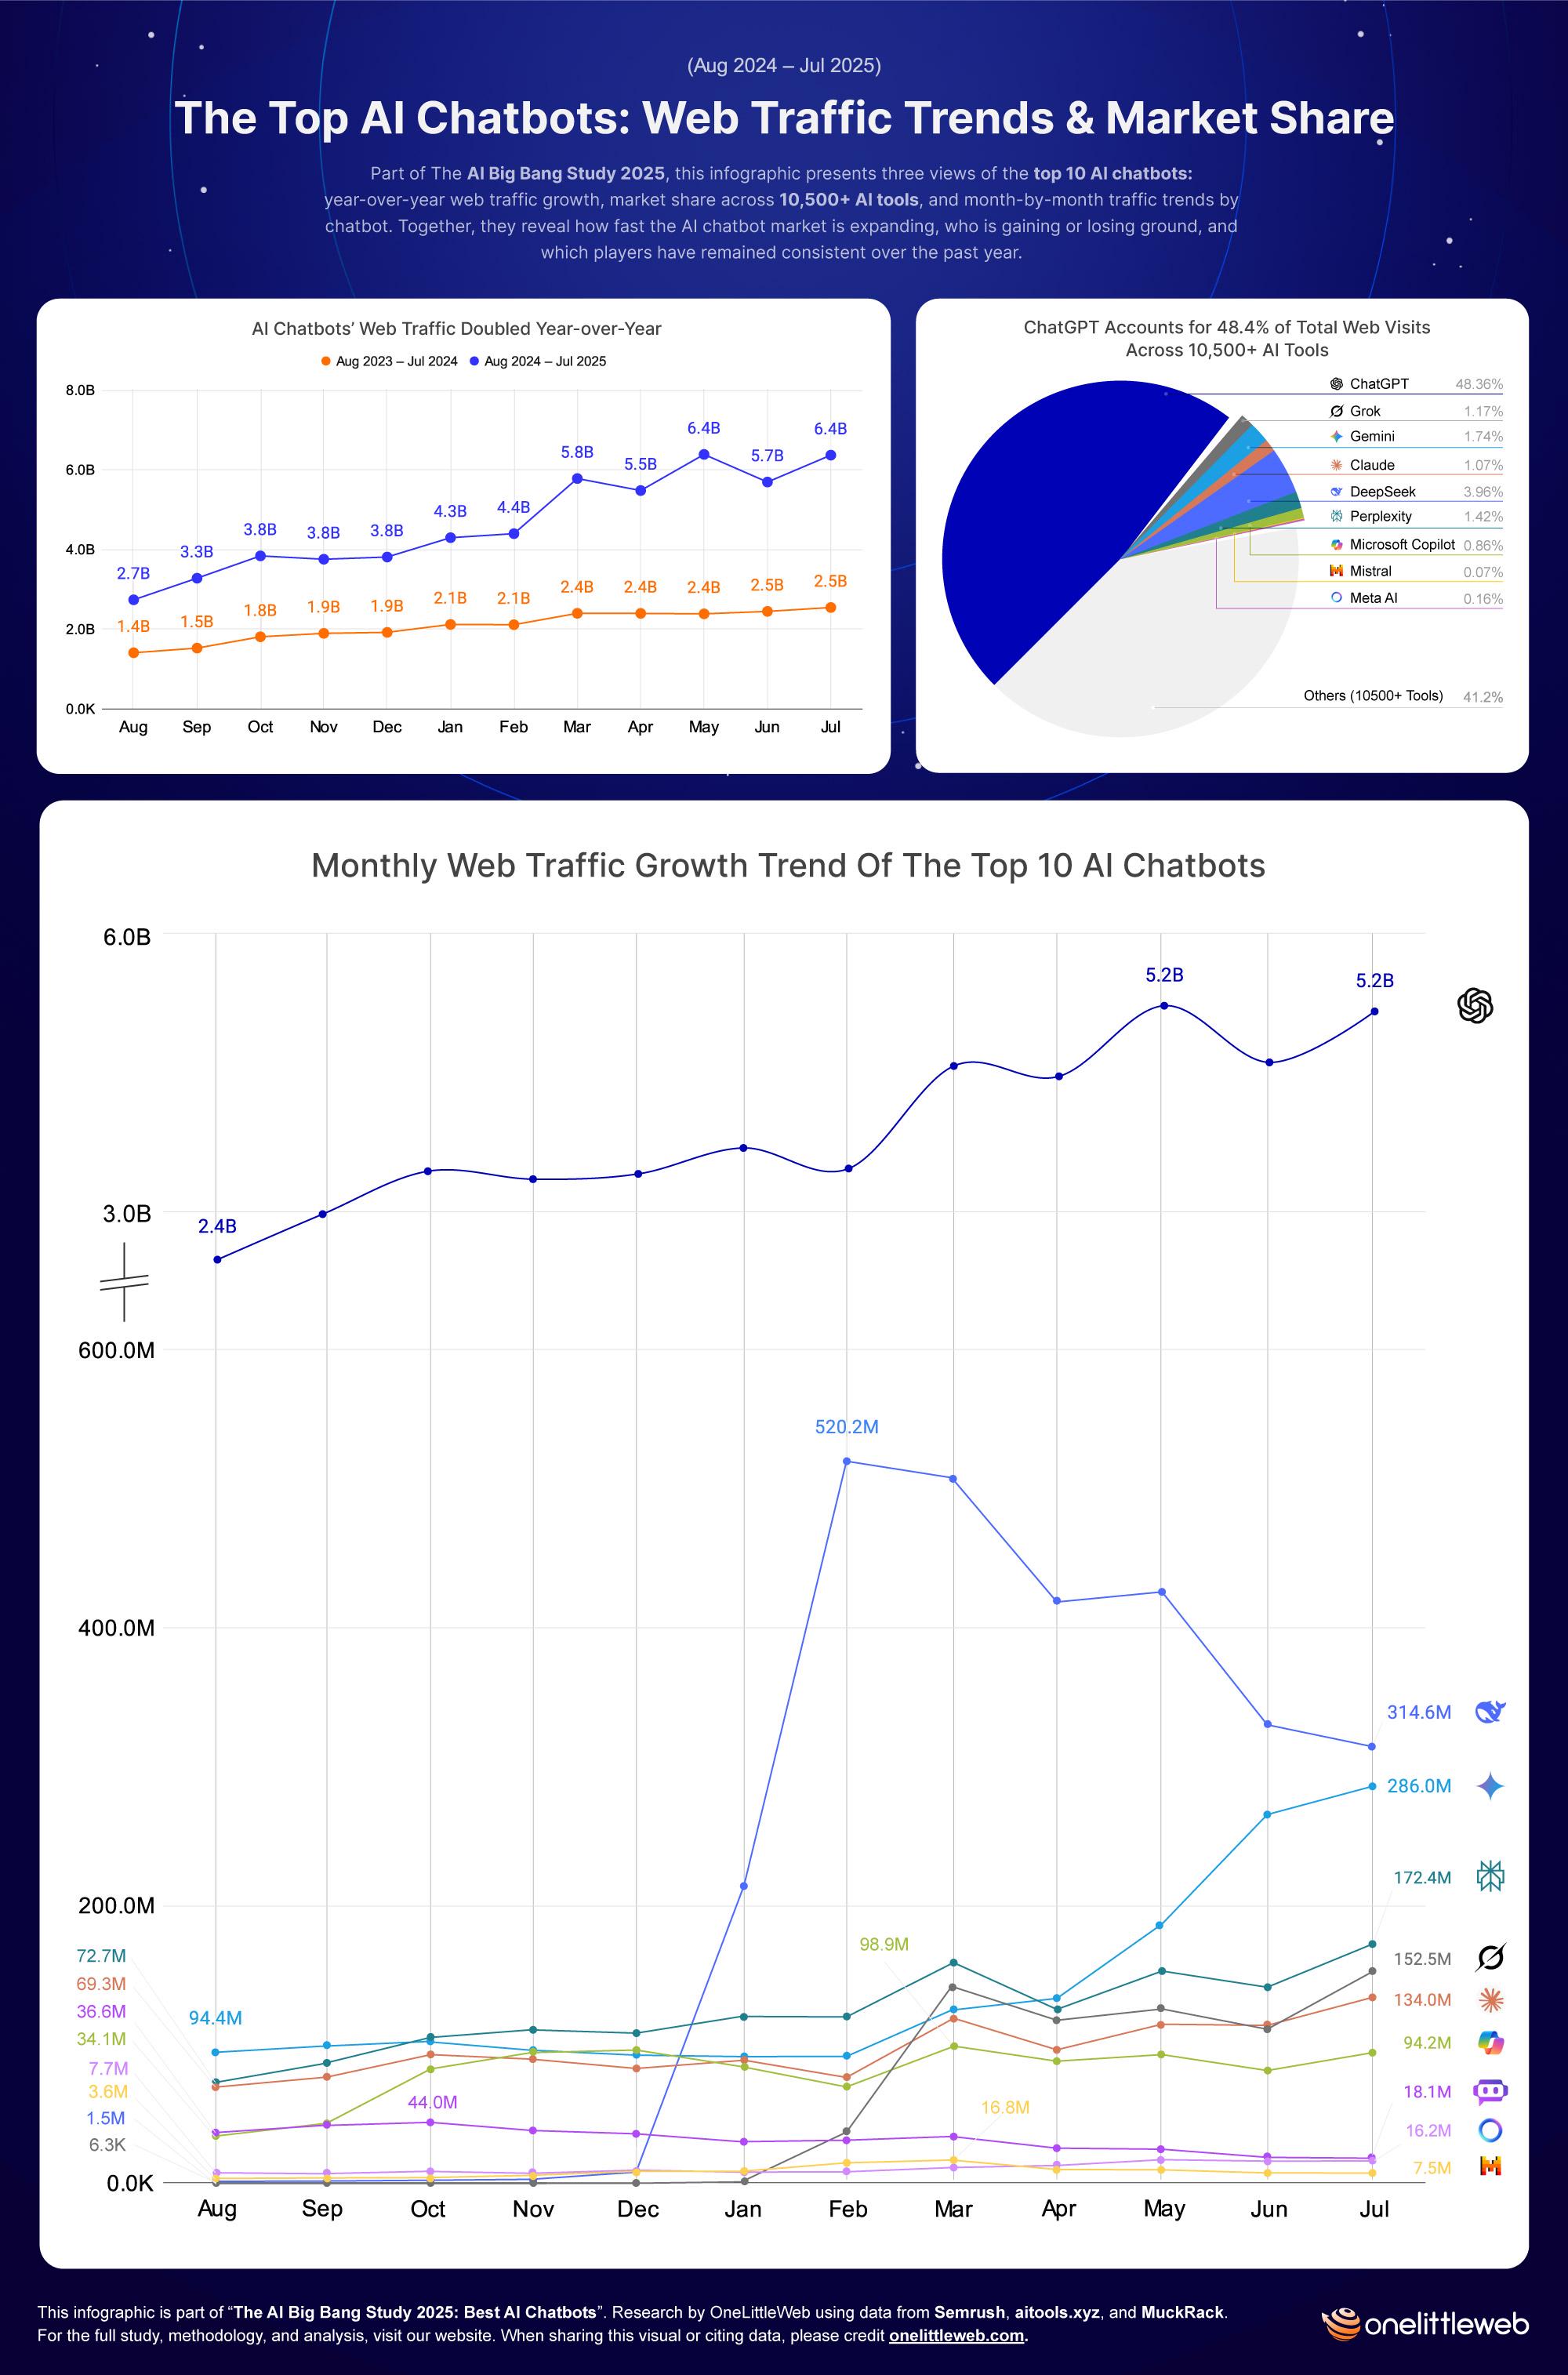
Between August 2024 and July 2025, global AI tools generated nearly 100B web visits.
What stands out: the top 10 chatbots captured 58.8% of all that traffic — around 55.9B visits.
This infographic breaks it into three views:
🔎 It’s a snapshot of how adoption is accelerating, but also how leadership shifts fast depending on the metric.
Would love to hear your thoughts:
(Source: The AI Big Bang Study 2025 — methodology: 10,500+ AI tools tracked with Semrush & Aitools xyz data)
r/dataisbeautiful • u/Axiom_Gaming • 7d ago
Memory Bandwidth measures how much data a GPU can move between its chip and video memory per second, expressed in GB/s. Formula: Memory Frequency × Bus Width × 2 ÷ 8.
Why it matters:
It also impacts operational costs in big ways:
So beyond raw performance, bandwidth efficiency shapes how affordable and sustainable GPU computing really is.
Interactive GPU Memory Bandwidth Evolution (2007–2025) analysis
r/dataisbeautiful • u/Alienturnedhuman • 6d ago
Created using python, only library used is pycairo for rendering.
Explanation:
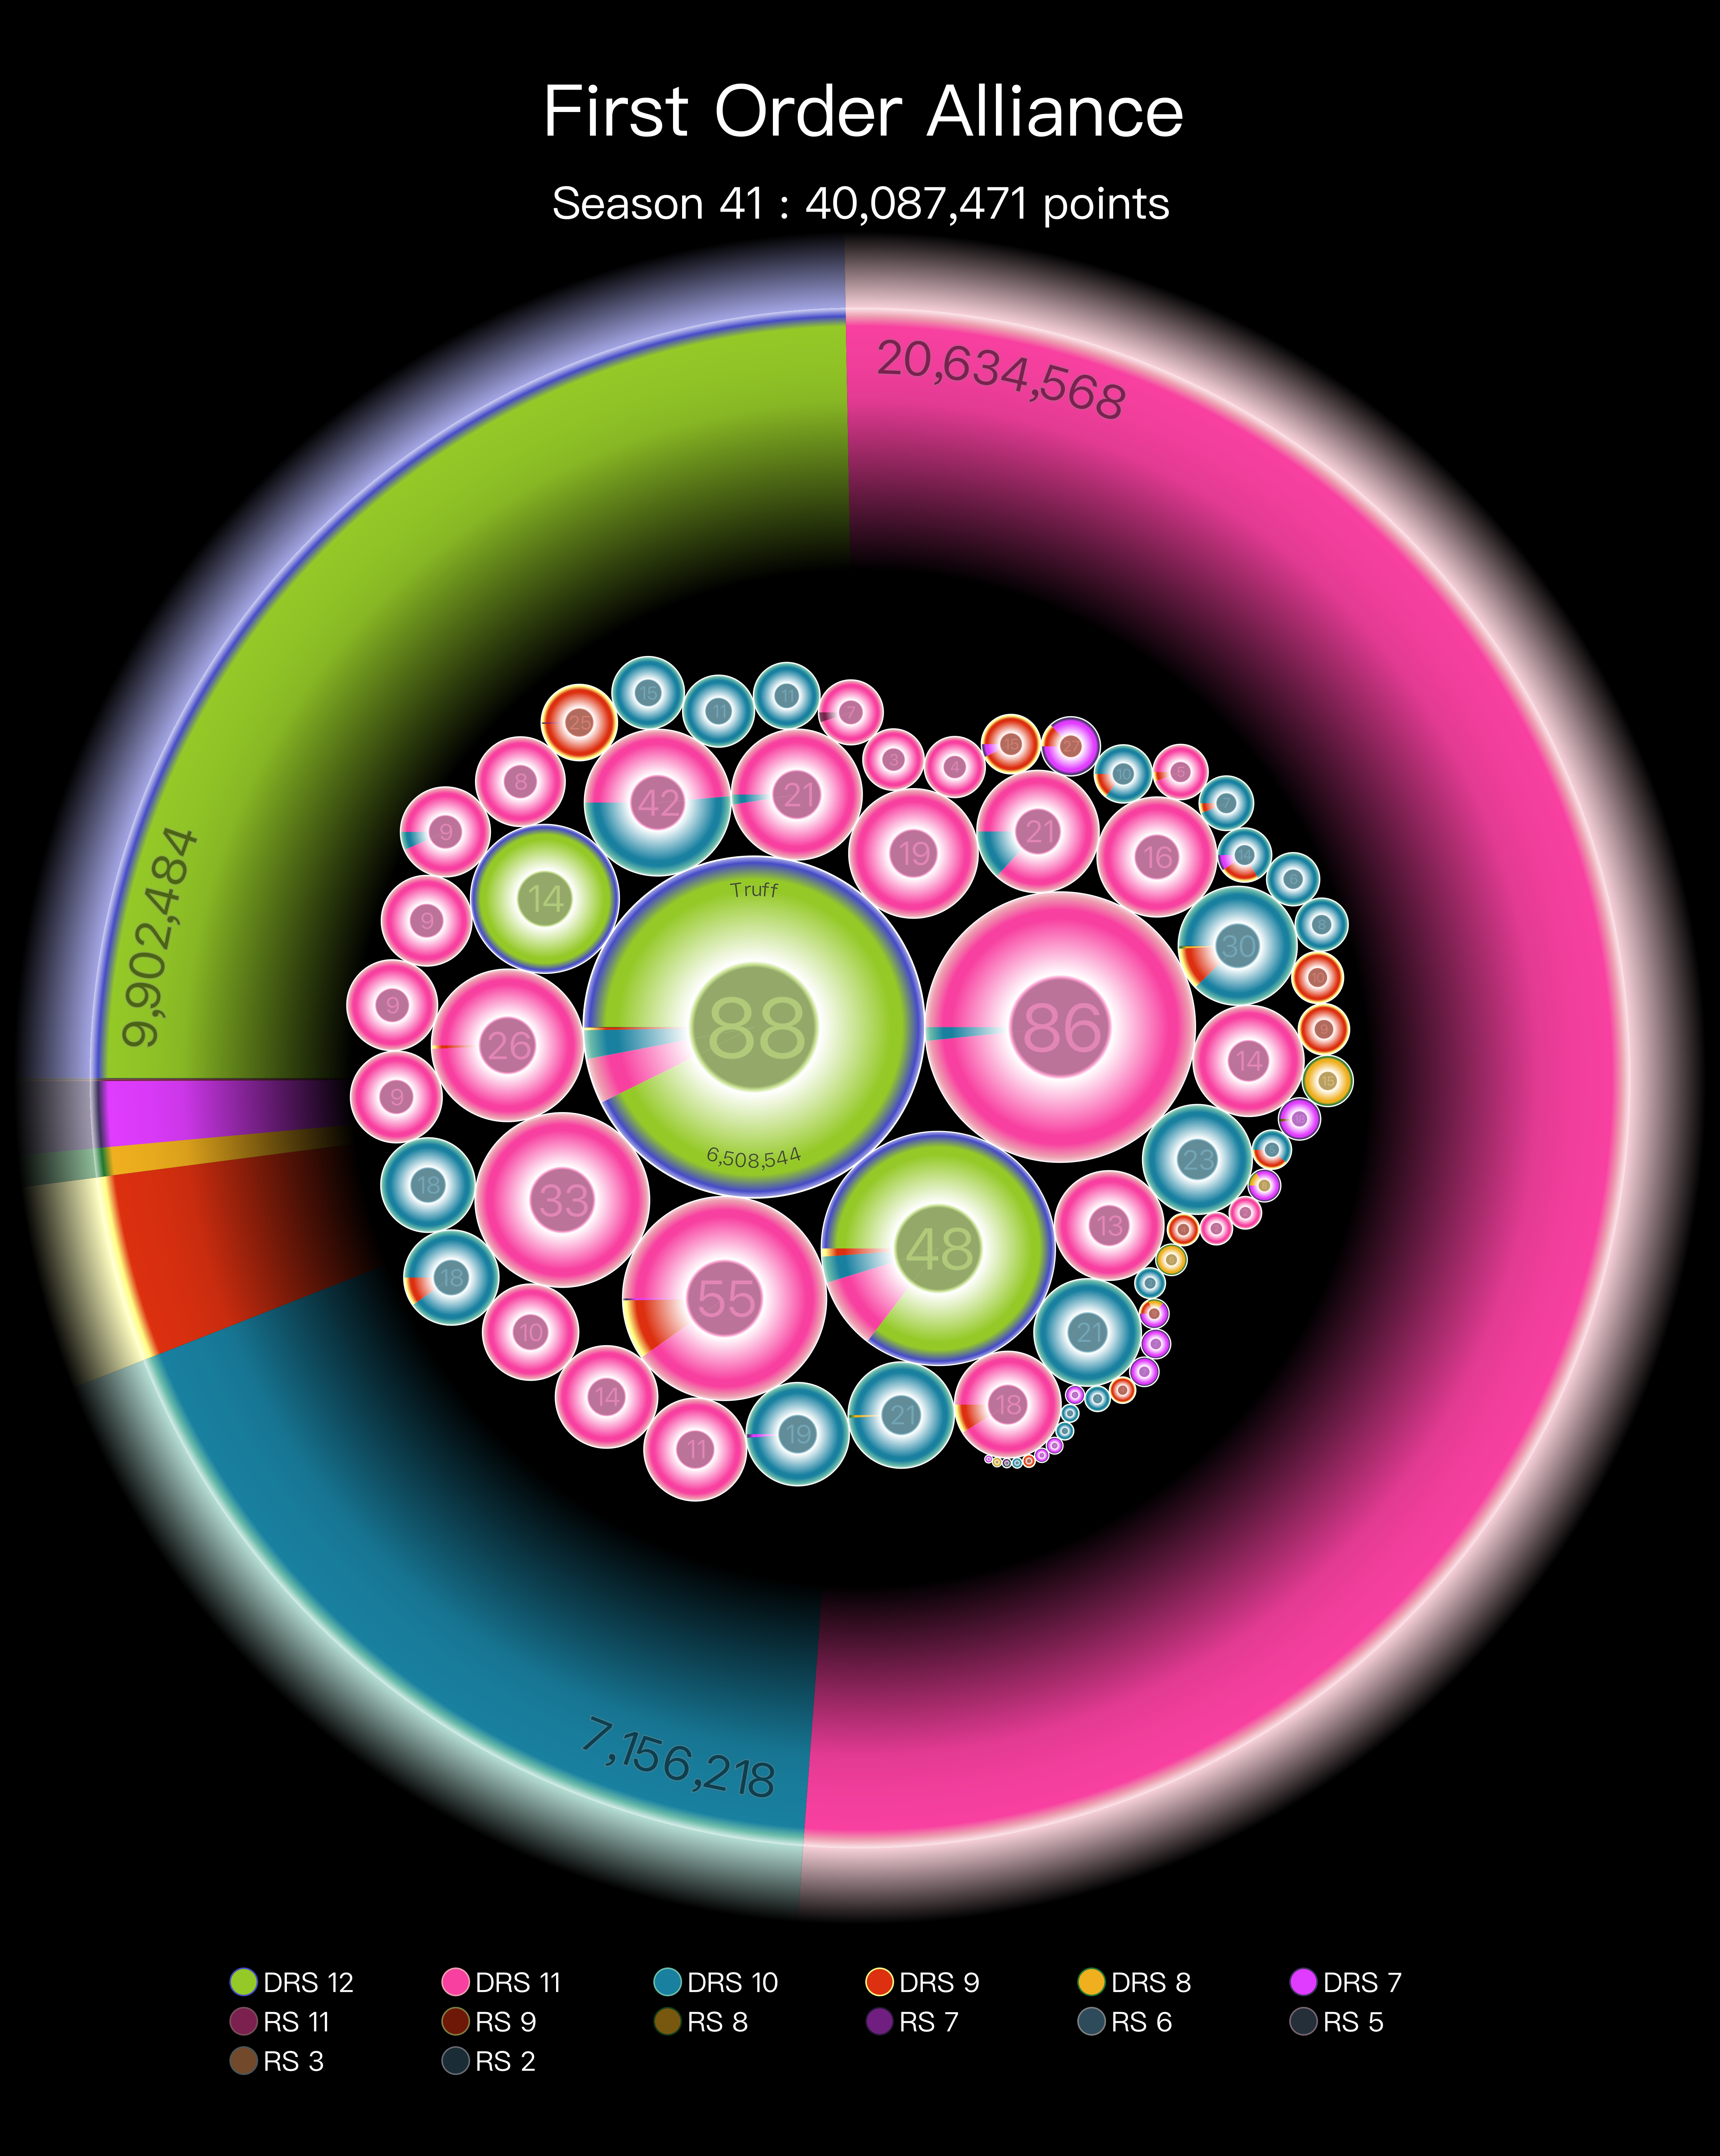
Hades Star is an MMO that hosts a monthly event where players compete over 48 hours in team to set the highest collective score doing Red Star or Dark Red Star missions (from level 2 to 12)
I am a player in the team that finished first this event, and wrote the bot that collects the team's scores from the game's webhook. (I only have access to my own team's data)
Normally, the team results are presented in a simple ranked table - but I felt given it's meant to be a team effort, having a ranked table didn't convey the 'group effort' nature of the event. Especially as higher leveled players can pull in over 10x the number of points per mission compared to the lower leveled players.
Originally I was going to try implementing a Voronoi based chart, however writing the code to do a (visually interesting) packed bubble chart was easier, but it also gave me the opportunity to turn each bubble into a pie chart showing where the player scored their points.
So, the area of each bubble is proportional to a player's score (IIRC each pixel is worth 1024 / pi points) - I then added the number of missions in the central circle. I removed all players' details for anonymity, except for the top scoring player (who gave permission) to give a sense of scale for the other bubbles.
As a final visual flourish, I added a donut shaped pie chart showing the team's total points distribution (this is just to frame the packed bubble chart, so doesn't match the same points per pixel value as the player bubbles, it is just scaled to frame the bubbles)
The colours are taken from the planet colour for the respective mission level.
As I have all the data in a chronological database I intend to go through make an animated version of the chart where the bubbles grow in relaton to the timeline.